

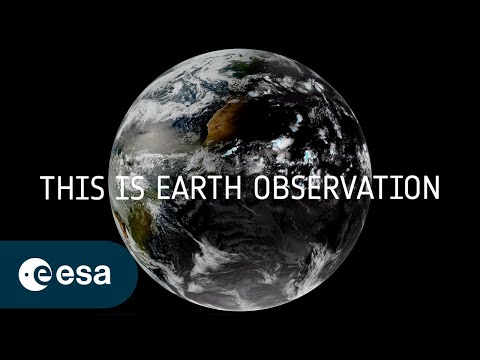
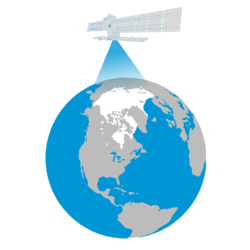
The Power of Earth Observation
We are all intricately interconnected to our Earth – from the trees that provide us with oxygen, to the natural sources that shape our landscape. ESA’s Earth observation programme is at the forefront of monitoring...

Copernicus Browser Case Study: Algal Blooms From Space
Brief description This activity supports teachers in guiding their students to investigate algal blooms and their impacts using satellite imagery....
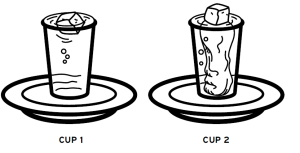
Sea ice from space – Investigating Arctic sea ice and its connection to climate
Brief description In this set of three activities, students will investigate Arctic sea ice. First, they will perform a hands-on...

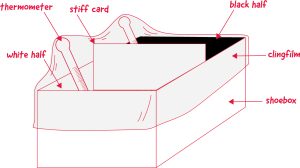
One year on Earth – Understanding seasons
Brief description This resource includes two activities to foster and enhance pupils’ knowledge of seasons, and focuses on the basic...
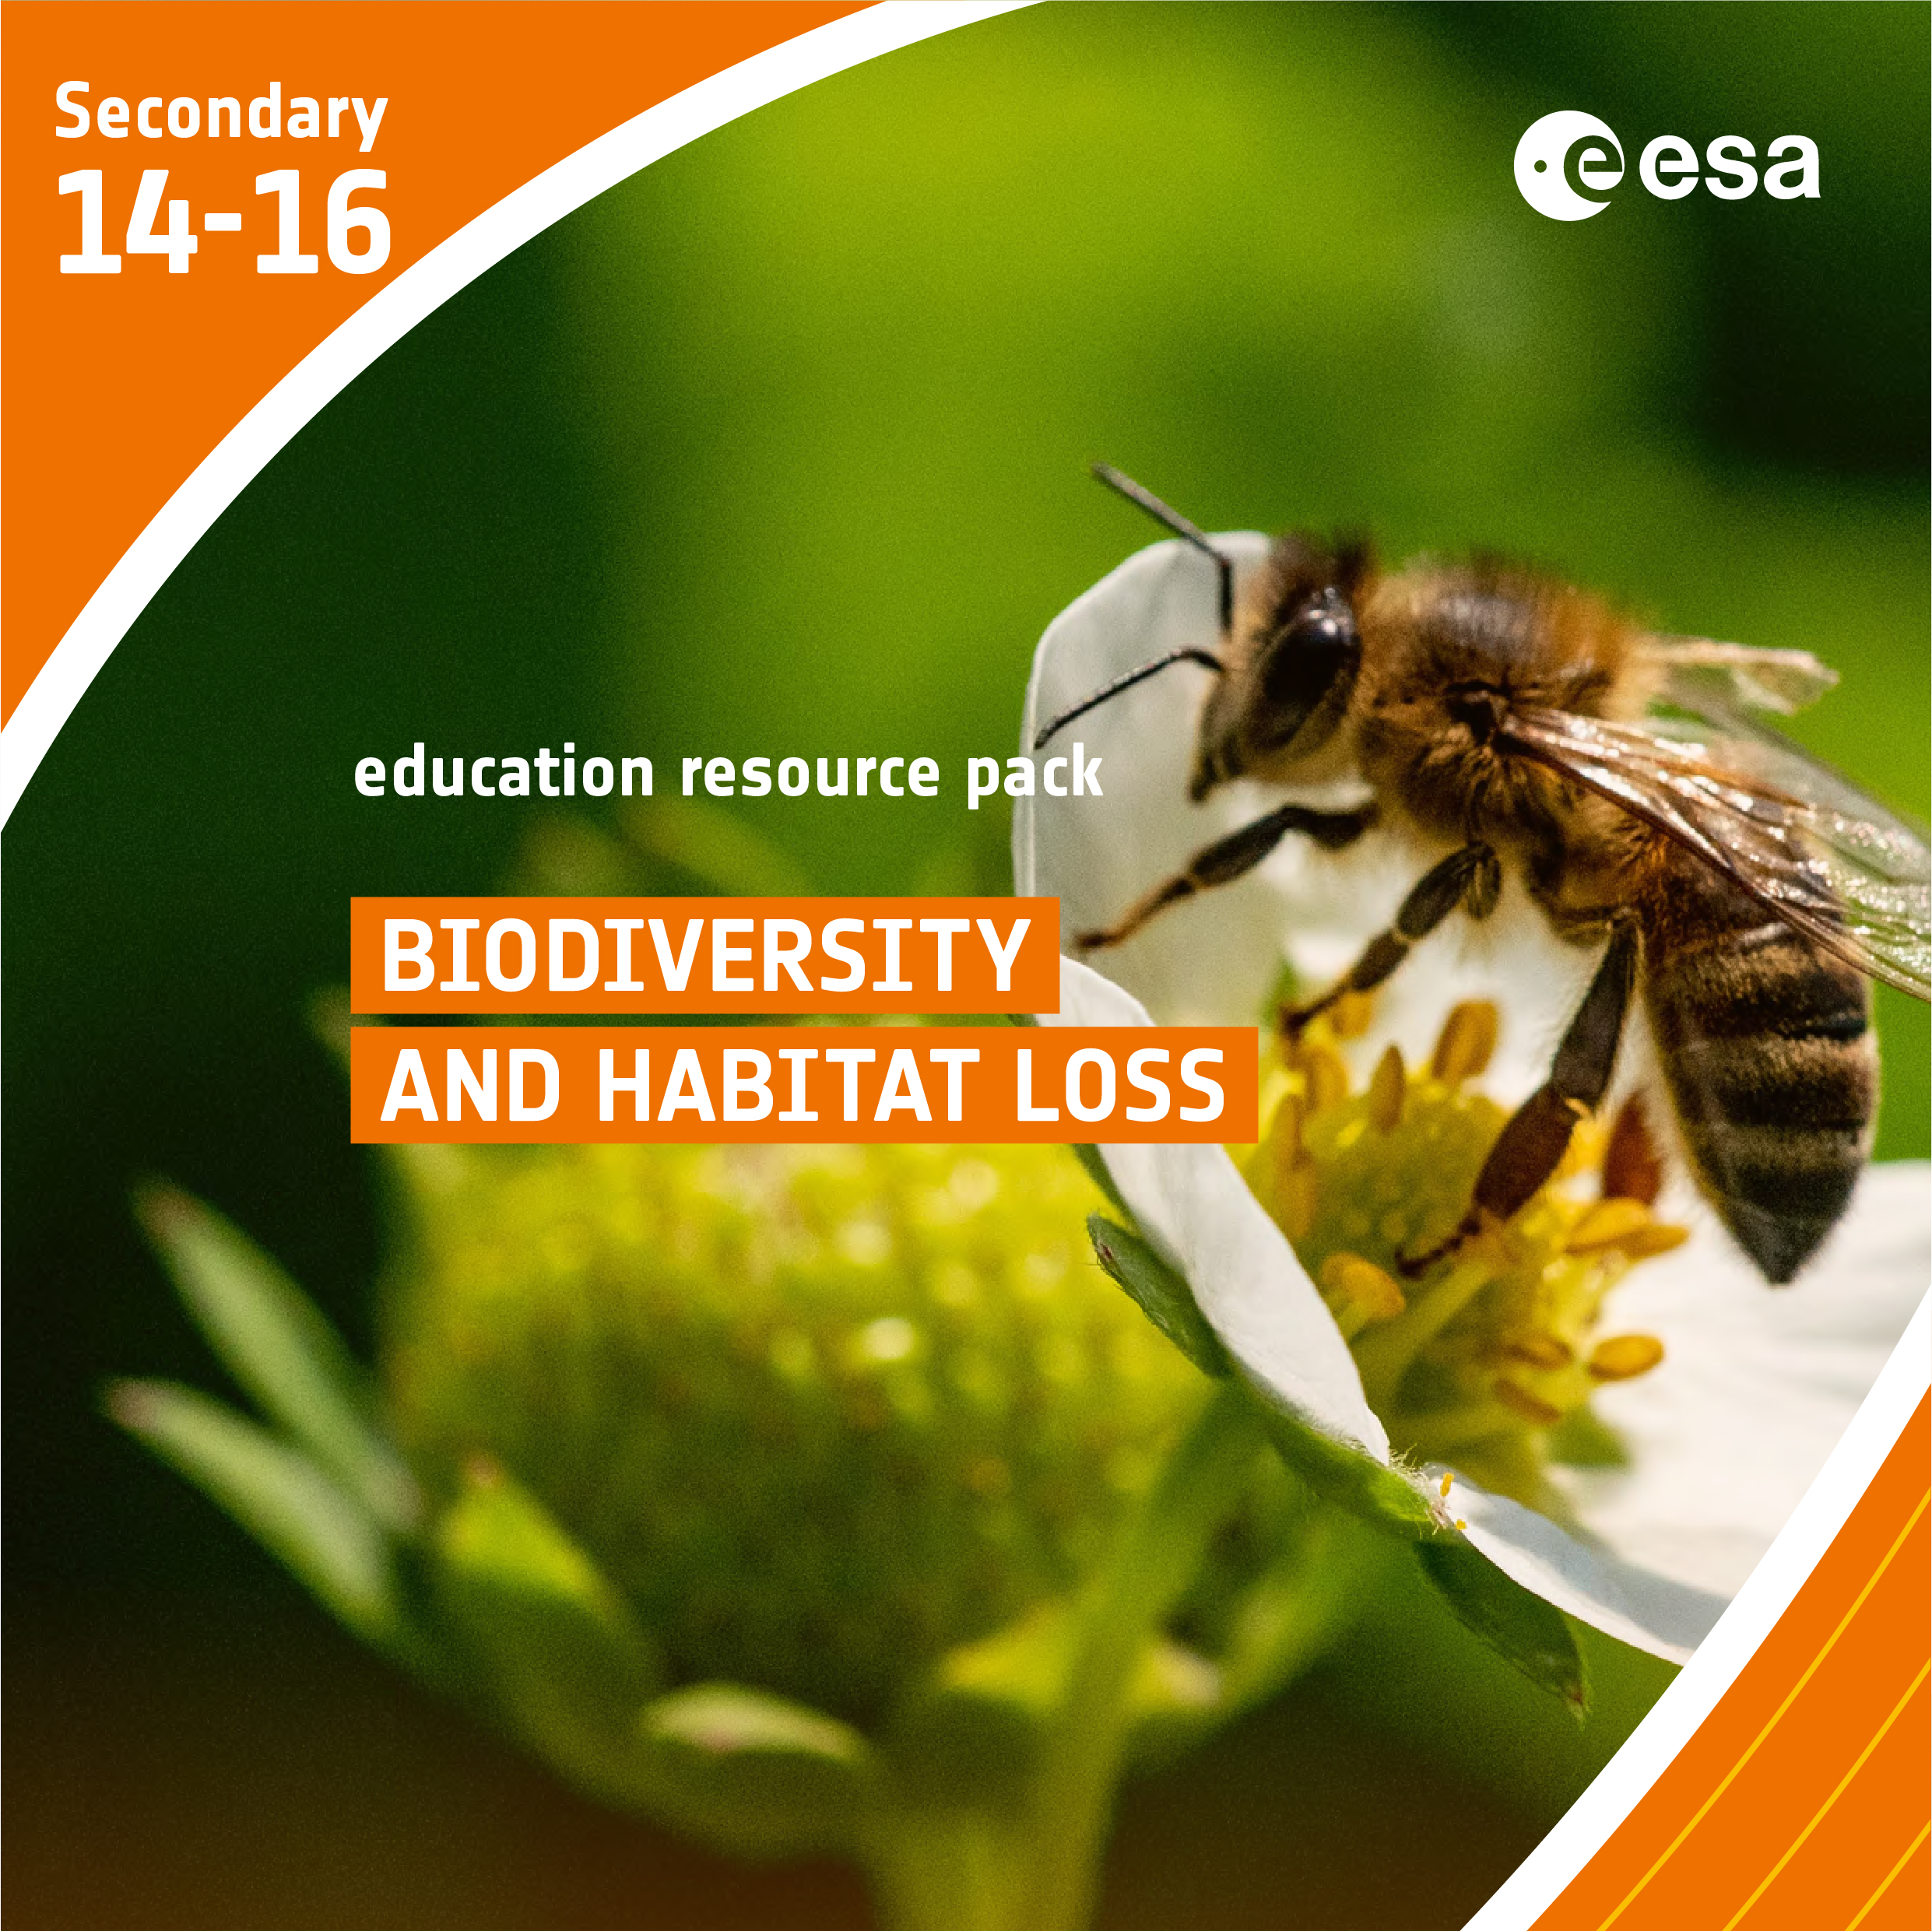
Biodiversity and Habitat Loss
Brief description In this set of three activities, students will start with a reading assignment that introduces vocabulary and ideas...
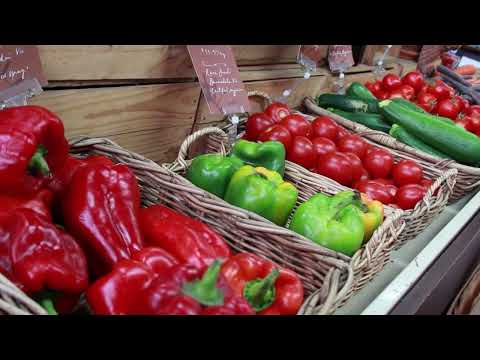
Land-use change
Satellite images enable us to document changes in land use very precisely. Discover how satellites provide information about land use on a global scale. Video by ESERO Germany (in English).