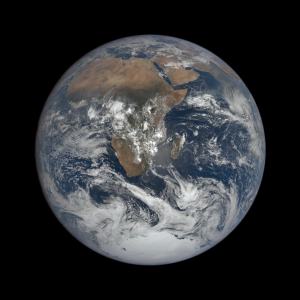
Satellites observe the Earth
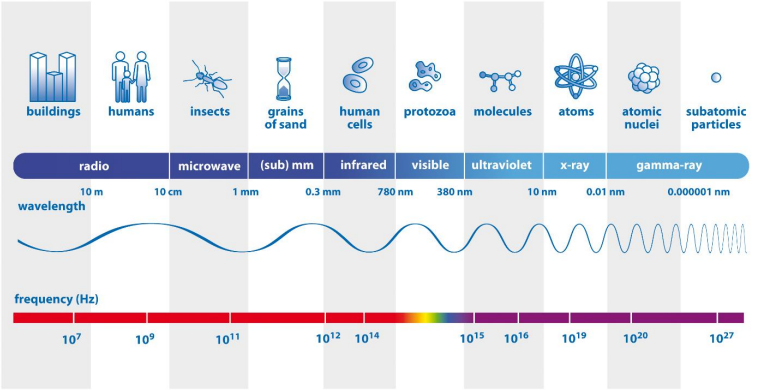
Satellites observe the Earth using a range of wavelengths on the electromagnetic spectrum. Discover how we can build a more complete picture of Earth’s climate by sampling the electromagnetic spectrum at multiple wavelengths.

Earth under the lid – Understanding the greenhouse effect
Brief description In this set of two activities, pupils will learn about our atmosphere and the greenhouse gases that it...

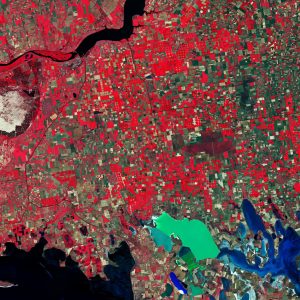
Colour vision
Discover how satellites like Copernicus Sentinel-2 provide a new perspective of Earth’s land and vegetation.

Paxi – Day, night, and the seasons
Brief description:Join Paxi as he explores why we have day and night, and learn why the Earth has seasons. Have...

The greenhouse effect and its consequences – Investigating global warming
Brief description In this set of three activities, students will do hands-on experiments and learn how to interpret satellite images...
Country under Threat – The prospects for life on small islands
Brief description In this set of four activities pupils will learn about the causes and potential impacts of sea-level rise...