Earth Observation Data
Types of Earth Observation data
Earth Observation (EO) is the collection, analysis and presentation of data to better understand our planet. Earth observations can be taken at a local ground level or acquired from remote sensing platforms such as satellites. As satellites continuously acquire images of our planet from orbit, they have become powerful scientific tools to enable better understanding of the Earth and its environment. From above, satellites can collect data from sites all around the world, including places too remote to visit in person.
Earth observations may include:
- images taken from remote-sensing satellites;
- measurements taken by a thermometer, wind gauge, ocean buoy, altimeter or seismometer;
- photographs taken on the ground or from airplanes;
- radar or sonar images from land-based or ocean-based instruments;
- a birdwatcher’s notes on bird sightings;
- measuring land use change;
- tracking biodiversity and wildlife trends;
- processed information such as maps or weather forecasts.
I want to investigate...
Select your topic and consult the cards below for more information on how to start your investigation. Choose from one of the following topics: weather, climate, extreme weather, floods, droughts, water bodies, air quality, flora, fauna and wildfires.
- Start by reading some general climate documents (do not go into detailed reports) of the World Meteorological Organisation (WMO) and of the Intergovernmental Panel on Climate Change (IPCC). There is a summary for teachers available here.
- Find your local/regional/national meteorological institute or weather service in this list. You can also collect historical weather data.
- The Copernicus Climate Change Service (C3S) provides monthly climate bulletins and information about the past, present and future climate in Europe and the rest of the World.
- The C3S Climate & Energy Education demo displays four climate variables (air temperature, precipitation, wind speed and global horizontal irradiance) graphically for Europe.
- This classroom resource explains the difference between weather and climate and how scientists predict what Earth’s climate will be like in the future.
- Air Temperature
- Precipitation
- Wind
- Humidity
- Find your local/regional/national meteorological institute or weather service in this list.
- Get more background information about storms and tornadoes here.
- The products available in this link could help to determine the relationship between extreme weather events and the state of the atmosphere beforehand.
- You can investigate cloud and weather patterns making use of EO Data available in EO Browser. The true colour imagery in Copernicus Sentinel-3 satellite products as well as the cloud products available in Copernicus Sentinel-5P data can be particularly useful.
- Wind can tell us so much about how air masses move and how large storms move from being over the Atlantic to over Europe – as an example. This tool can often help visualise wind patterns, as well as atmosphere and ocean conditions.
- This classroom resource uses the example of Hurricane Matthew to explore the applications of Earth observation data in tracking hurricanes.
- Air Temperature
- Precipitation
- Wind
- Humidity
- Find your local/regional/national meteorological institute or weather service in this list.
- Look for historical maps to see how rivers have changed
- The European Drought Observatory provides drought-relevant information such as maps of indicators. Different tools, like graphs and compare layers, allow for displaying and analysing the information and irregularly published “Drought News” give an overview of the situation in case of imminent droughts.
- EO Browser offers a “Floods & Droughts” theme in Education mode with preselected satellite and visualization options.
- The Copernicus Emergency Management System provides maps about floods.
- EO Browser offers an “Oceans and water bodies” theme in Education mode with preselected satellite and visualization options.
- The BlueDot Water Observatory platform is based on the Copernicus satellite imagery and provides information about water levels of lakes, dams, reservoirs, wetlands and similar water bodies globally.
- The classroom resource Highways of the oceans explains sea currents and their importance for understanding local climates.
- Salinity
- Acidity
- Organisms
- Flora
- The European Environmental Agency (EEA) provides a lot of information on Air Quality.
- National environmental agencies can also be a good source of information.
- The Copernicus Sentinel-5P satellite is measuring NO2 and other pollutants from space. You can find data from this and other satellites in EO Browser. Select the theme Atmosphere and Pollution.
- This ESA EO Browser tutorial explains how to use satellite data to measure air pollution
- The Atmospheric monitoring service from the Copernicus programme provides a European and global forecast daily.
- You can find many ideas to build your own air quality sensor online. It is important to compare your measurements with official measurements to ensure accuracy. Whenever possible talk to experts from a local university or city officials in charge of air pollution measurements.
- Weather plays an important role in air quality. Therefore, you can also keep a register of local weather.
- Interview parents, teachers, grandparents, etc. asking them if they remember how the air quality used to be.
- EO Browser offers a “Vegetation” theme in Education mode with preselected satellite and visualization options.
- The ESA Education classroom resource Infrared webcam hack explains why we can see vegetation so well in satellite images.
- The Global Forest Watch (GFW) is an online platform that provides data and tools for monitoring forests. You can access near real-time information about where and how forests are changing around the world.
- Vegetation maps
- Plant types
- Plants per area
- Seasonal changes
- Analysis of bio indicators e.g. lichens. They can provide you with information regarding the health of vegetation.
- EO Browser offers a “Wildfires” theme in Education mode with preselected satellite and visualization options.
- This ESA EO Browser tutorial explores how to use satellite data to investigate wildfires.
- You can also have a look to what some Climate Detectives teams have done in past editions.
Which data can I use...
To complete your investigation you can make use of ground data and satellite data.
Ground data
How might local ground data be collected?
- Observations
- Measurements
- Counting
- Surveys
- Laboratory experiments
- Field experiments
Satellite data
The single location where we can learn the most about our planet is found nowhere on Earth but high up above it! Satellite images show the world through different eyes, and they can observe large-scale features.
Different satellites carry different types of sensors that give different kinds of data. The data are converted into information for a variety of applications such as monitoring air pollution, mapping deforestation and urban growth, or taking Earth’s temperature. While optical coverage is most often presented in the form of pictures, it involves digital data. The same raw data can be processed with computer software in many ways to extract specific information.
How might satellite data be accessed?
There are different tools that Climate Detectives Teams can use to access satellite data. Climate from Space and EO Browser are two online tools that give easy and free access to satellite data from different EO ESA missions.
Recommended tools
Climate from Space
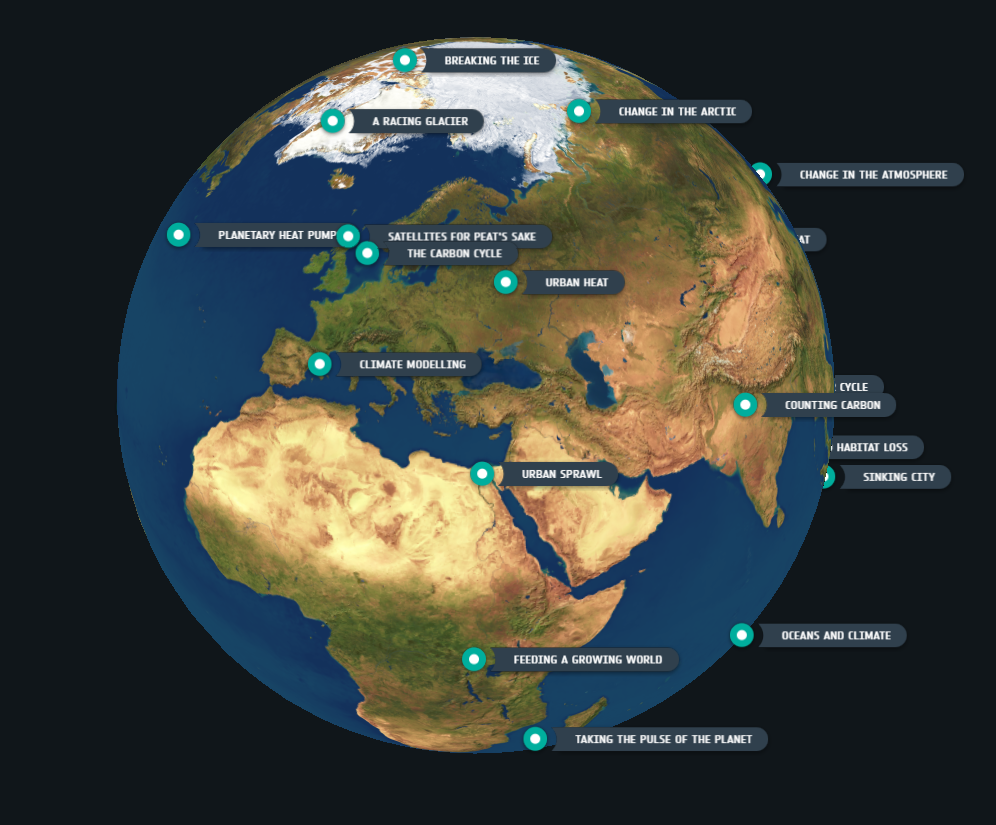
The Climate from Space app provides a graphical visualisation of archived satellite data that is already processed and combined to give you an overview of the different climate variables that scientists use to study climate change. It is a powerful visualisation tool specially to see the evolution overtime of variables such as carbon dioxide (CO2), ocean colour, sea surface temperature, and more. The site also gives access to a series of multimedia stories where the climate data is put in context and where you can find useful information about our dynamic planet and the major environmental changes we are facing, from coasts under threat to biodiversity and habitat loss.
EO Browser
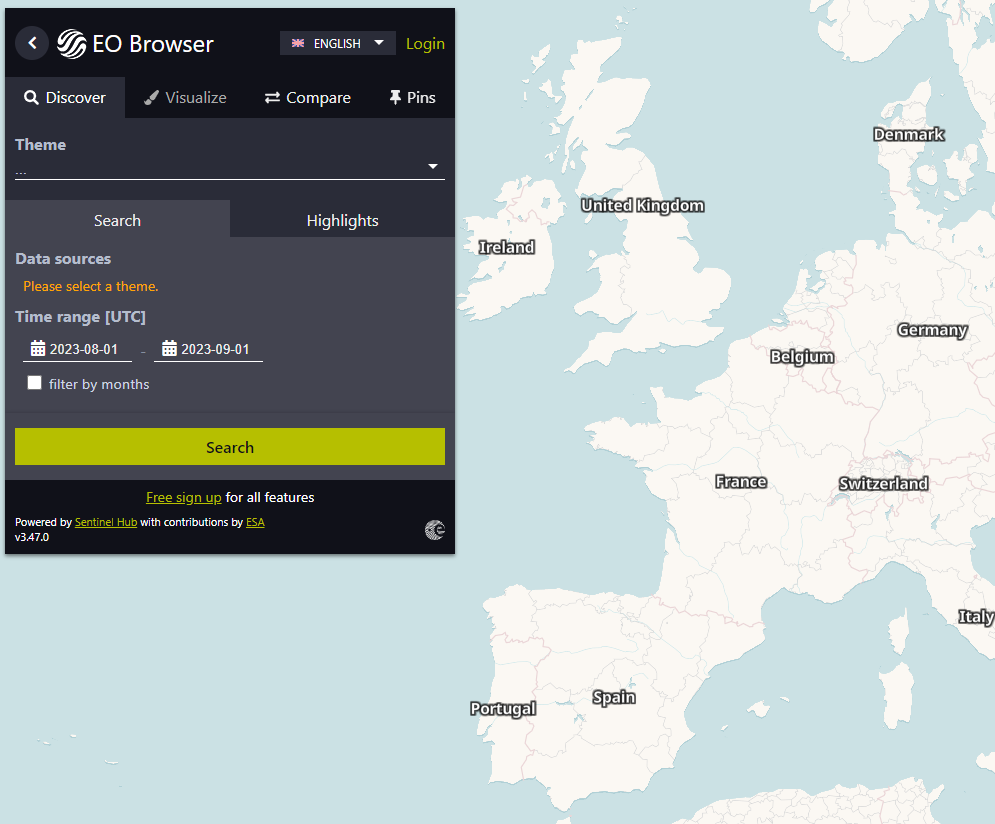
EO Browser is an online platform that combines an archive of different Earth observation missions and can be used to find satellite images of any area of interest. Data is freely available.
EO Browser’s Education mode gives the option to access specific satellite data tailored to a selected theme. Themes cover different topics, from agriculture to atmosphere and water bodies.
New to EO Browser? Watch the tutorials below on how to download an image and on how to create a timelapse! You can also have a look to the examples in EO Browser educational page.
Other tools
The Coastal Thematic Hub is a web portal by Copernicus. It provides data and information about coasts. Copernicus data which are e.g., used for decision-making and sustainable management practices in real life, can be easily used for your project.
MyOcean Viewer is an online interactive tool that allows users to view oceanographic data, across the Blue (physical), Green (biogeochemical), and White (sea ice) Ocean with variables such as temperature, salinity, and sea level, for any region in the world. It offers both historical, near real-time data, and forecasts up to 10 days in the future providing valuable insights into the ocean and marine environments. As part of the Copernicus Programme, MyOcean Viewer is free for the public to access.
Data and information for emergency response and disaster risk management are collected in the Copernicus Emergency Management Service (EMS) webpage. The Copernicus EMS On Demand Mapping provides information for selected emergency situation (from natural to man-made disasters) around the world. The Rapid Mapping gives access to geospatial information to support activities after a disaster while the Risk and Recovery Mapping supplies geospatial information to support Disaster Management before, during and after an event.
Part of the Copernicus Emergency Management Service is also the Copernicus EMS exposure mapping, which provides accurate and continuously updated information on the presence of human settlements and population by using the Global Human Settlement Layer. Different datasets are available to explore the amount of resident population with Population grids or to find out about land use and density in human settlements with Built-up surface grids.
The European Flood Awareness Systems (EFAS) provides forecast information for the flood risk management and is part of the Copernicus Emergency Management Service. The Copernicus EMS Early Warning and Monitoring is happening on a national, regional but also global level.
The European Forest Fire Information System (EFFIS) provides near-real time data about forest fires and is used in the wildfire management at the national and regional level for EU member states, the Middle East and North Africa. Next to a current situation viewer, it also offers a map to see the risk of wildfires and a lot more. It is part of the Copernicus EMS Early Warning and Monitoring programme.
The Drought Observatory provides drought-relevant information and early-warnings on European and worldwide level. Its is part of the Copernicus Emergency Management Service. Maps and data can be used to investigate your project about droughts.
The Water Observatory provides current and historical data on water resources condition on a global scale. With this tool you can monitor e.g., the water level of dams, reservoirs and lakes in near real time across the planet.
The Copernicus Sentinel-5P Mapping Portal provides data about the atmosphere. Concentrations of air pollutants are listed for an European but also worldwide scale. Changes in emissions can be monitored and the influence of fires or volcanic eruptions on the air can be followed through this tool.
The Global Forest Watch (GFW) is an online platform to monitor forest by yourself. This tool allows anyone to access the near real-time data about forest and where and how they are changing around the world.
The Copernicus Land Monitoring Service offers access to dashboards with different topics using data of land monitoring. Land cover and land cover changes in European cities and countries can be investigated and data about the sealed surfaces are available to help you working on your project.
The Ocean Virtual Laboratory is an ESA funded tool. The virtual platform combines EO datasets and related model / in-situ datasets. Using this tool let you feel like oceanographers. Explore ocean currents on a global scale, analyse the temperatures in different locations or discover the salinity of the water.
The Earth Observing Dashboard is a tool made by NASA, ESA and JAXA and combines their resources, technical knowledge, and expertise to understand more about the changing environment with human activity on a global level. Different selected themes show the changes of specific indicators in countries and regions over the time. Some of these themes are e.g., biomass, covid-19, economy or agriculture.
Teal is a free visualisation tool that provides free access to easy to use climate data. Climate variables from 1950 to near real time and carbon emissions from 1960 are collected in the tool. In this tool you can explore different projections of climate variables from 2015 to 2100 for three different GHG emission scenarios (low, medium, high). You can access data of countries and sub-countries.

The Copernicus Browser gives access to a collection of high-resolution satellite images from all Copernicus missions. It is a user-friendly and intuitive browser. Browse your area of interest, search for visualizations and explore changes through time and more by choosing different configurations themed from agriculture to volcanoes.
Examples of data collection
Ground data
Example: Field experiments – or campaigns – are an integral part of ESA’s continuing effort to develop new and better instruments for observing Earth from space. Measurements gathered from the air and on the ground, often at the same time as the satellite passes overhead, are used for comparison. This is essential to ensure that the satellite is still delivering accurate information.

Satellite data
The European Space Agency is developing a family of satellites called Sentinels for the European Union’s Copernicus programme – the largest environmental monitoring programme in the world! Each Sentinel satellite carries state-of-the-art instruments that generate imagery and data open to users worldwide, giving everyone the opportunity to become an Earth observer.

Example: satellite images can detect phytoplankton blooms from space. Although most types of phytoplankton are individually microscopic, the chlorophyll they use for photosynthesis collectively tints the colour of the surrounding ocean waters. These tiny organisms can be detected with dedicated ‘ocean colour’ sensors, such as Envisat’s Medium Resolution Imaging Spectrometer, which acquired this image on 17 August 2011.


