


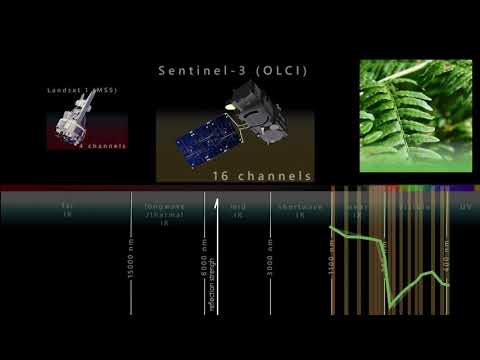
The spectral resolution
Earth observation satellites are guardians of our planet. Thanks to remote sensing technology and daily data collection, researchers are able to better monitor our planet’s oceans and rising sea levels from space. ESA senior advisor...

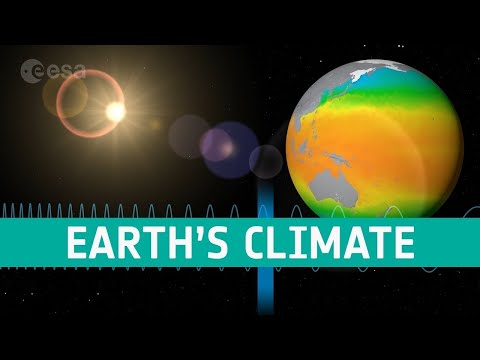
The Electromagnetic Spectrum – Introduction
Learn about the electromagnetic spectrum and how satellites can see the invisible. Video by ESERO Germany (in English).
Satellites observe the Earth
Satellites observe the Earth using a range of wavelengths on the electromagnetic spectrum. Discover how we can build a more complete picture of Earth’s climate by sampling the electromagnetic spectrum at multiple wavelengths.

Ocean views
Ice and snow can be a hot topic when talking about climate. The polar regions are very fragile and can tell us a lot about how Earth’s climate is changing. Andrew Shepherd of the University...
Taking the Pulse of the Planet- Upper secondary
Brief description In this set of three activities, students will learn about how data is collected by sensors and how...

Nose up high in the sky – Observing and measuring weather conditions
Brief description In this set of three activities, students will learn how their senses and instruments can be used to...