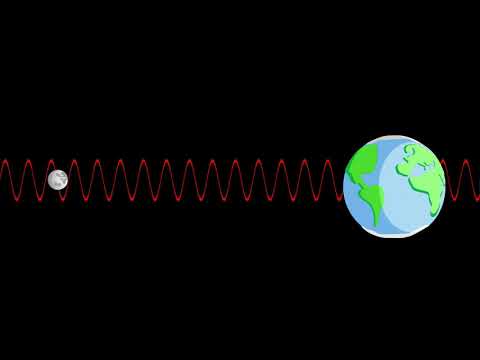
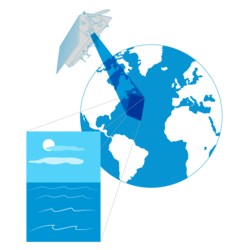
The Electromagnetic Spectrum – Advanced
Explore what satellites can see with their sensors and learn about the properties of the electromagnetic waves. Video by ESERO Germany (in English).
The Water Cycle
Brief description In this set of six activities, students will learn about the water cycle and, in particular, how water...
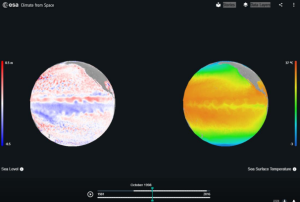
Satellites observe the Earth
Satellites observe the Earth using a range of wavelengths on the electromagnetic spectrum. Discover how we can build a more complete picture of Earth’s climate by sampling the electromagnetic spectrum at multiple wavelengths.
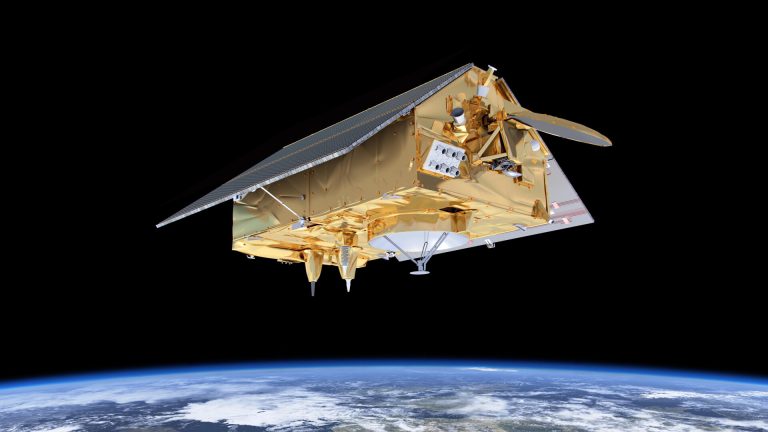
The Power of Earth Observation
We are all intricately interconnected to our Earth – from the trees that provide us with oxygen, to the natural sources that shape our landscape. ESA’s Earth observation programme is at the forefront of monitoring...
Highways of the Oceans – Sea currents and the connection to climate
Brief description In this set of three activities, students will use an multimedia module to learn about sea currents, the...
The Carbon Cycle
Brief description In this set of three activities, students will learn about the carbon cycle and use it to identify...