

One year on Earth – Understanding seasons
Brief description This resource includes two activities to foster and enhance pupils’ knowledge of seasons, and focuses on the basic...

Saving lives when disasters strike
Discover how satellite images can help with disaster relief and recovery anywhere in the world.
Infrared Webcam Hack – Using infrared light to observe the world in a new way
Brief description This set of three activities will enable students to understand the electromagnetic spectrum and observe infrared radiation through...

Copernicus Browser Case Study: Oil Spills From Space
Brief description This activity supports teachers in guiding their students to investigate oil spills and their impacts using satellite imagery....
Paxi explores wind
Brief description: Learn about wind, what causes it and how and why we study it in the latest Paxi adventure...
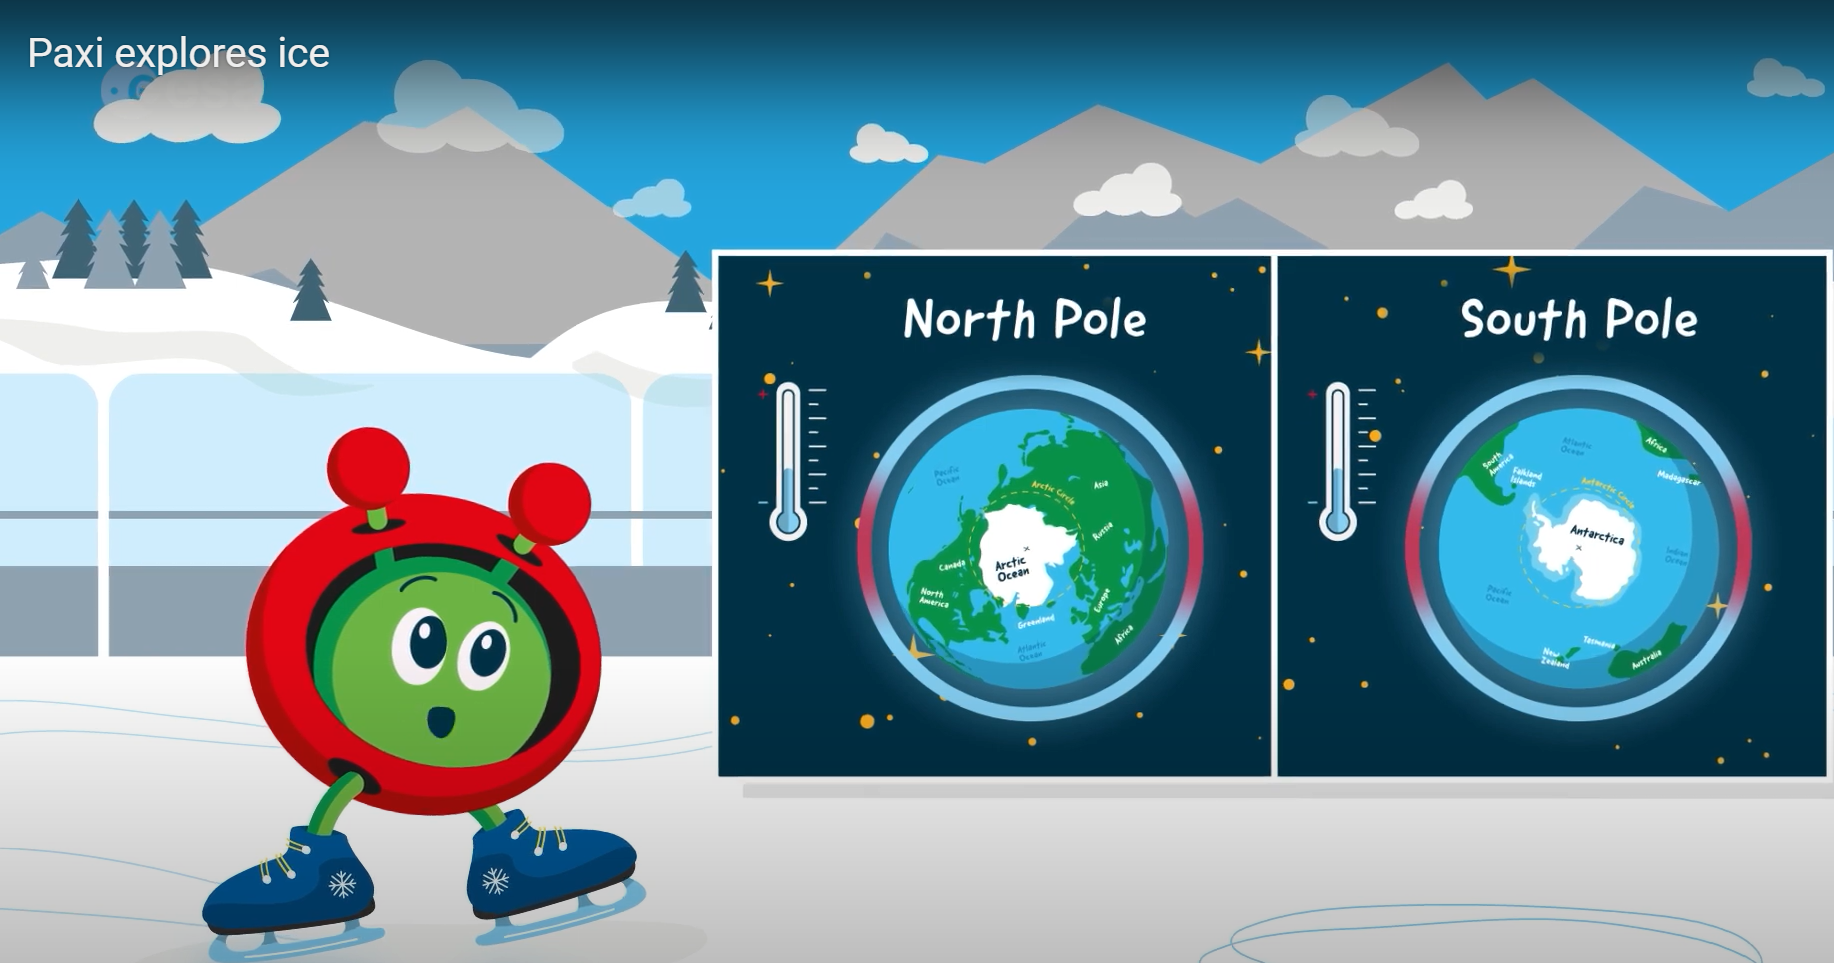
Paxi explores ice
Brief description:Join Paxi on an adventure to the North and South poles, to learn more about ice and its role...