
Nose up high in the sky – Observing and measuring weather conditions
Brief description In this set of three activities, students will learn how their senses and instruments can be used to...

The spatial resolution
The observation of our planet with the help of satellites largely depends on the different characteristics of their sensors. The spatial resolution, that is explained in this video, is one of these characteristics. Video by...
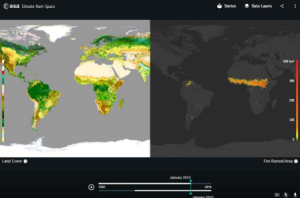
Climate Change Kit
Explore ESA’s interactive Climate Change Kit The Climate Change from Space Kit is an interactive PDF that takes the reader through...
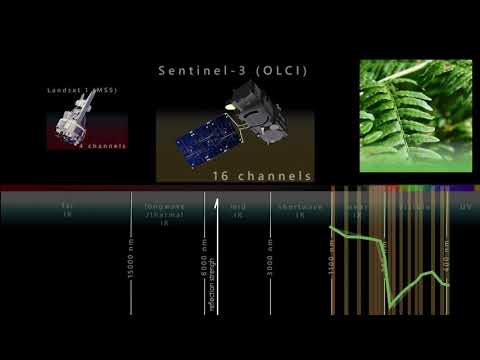
The spectral resolution
Earth observation satellites are guardians of our planet. Thanks to remote sensing technology and daily data collection, researchers are able to better monitor our planet’s oceans and rising sea levels from space. ESA senior advisor...
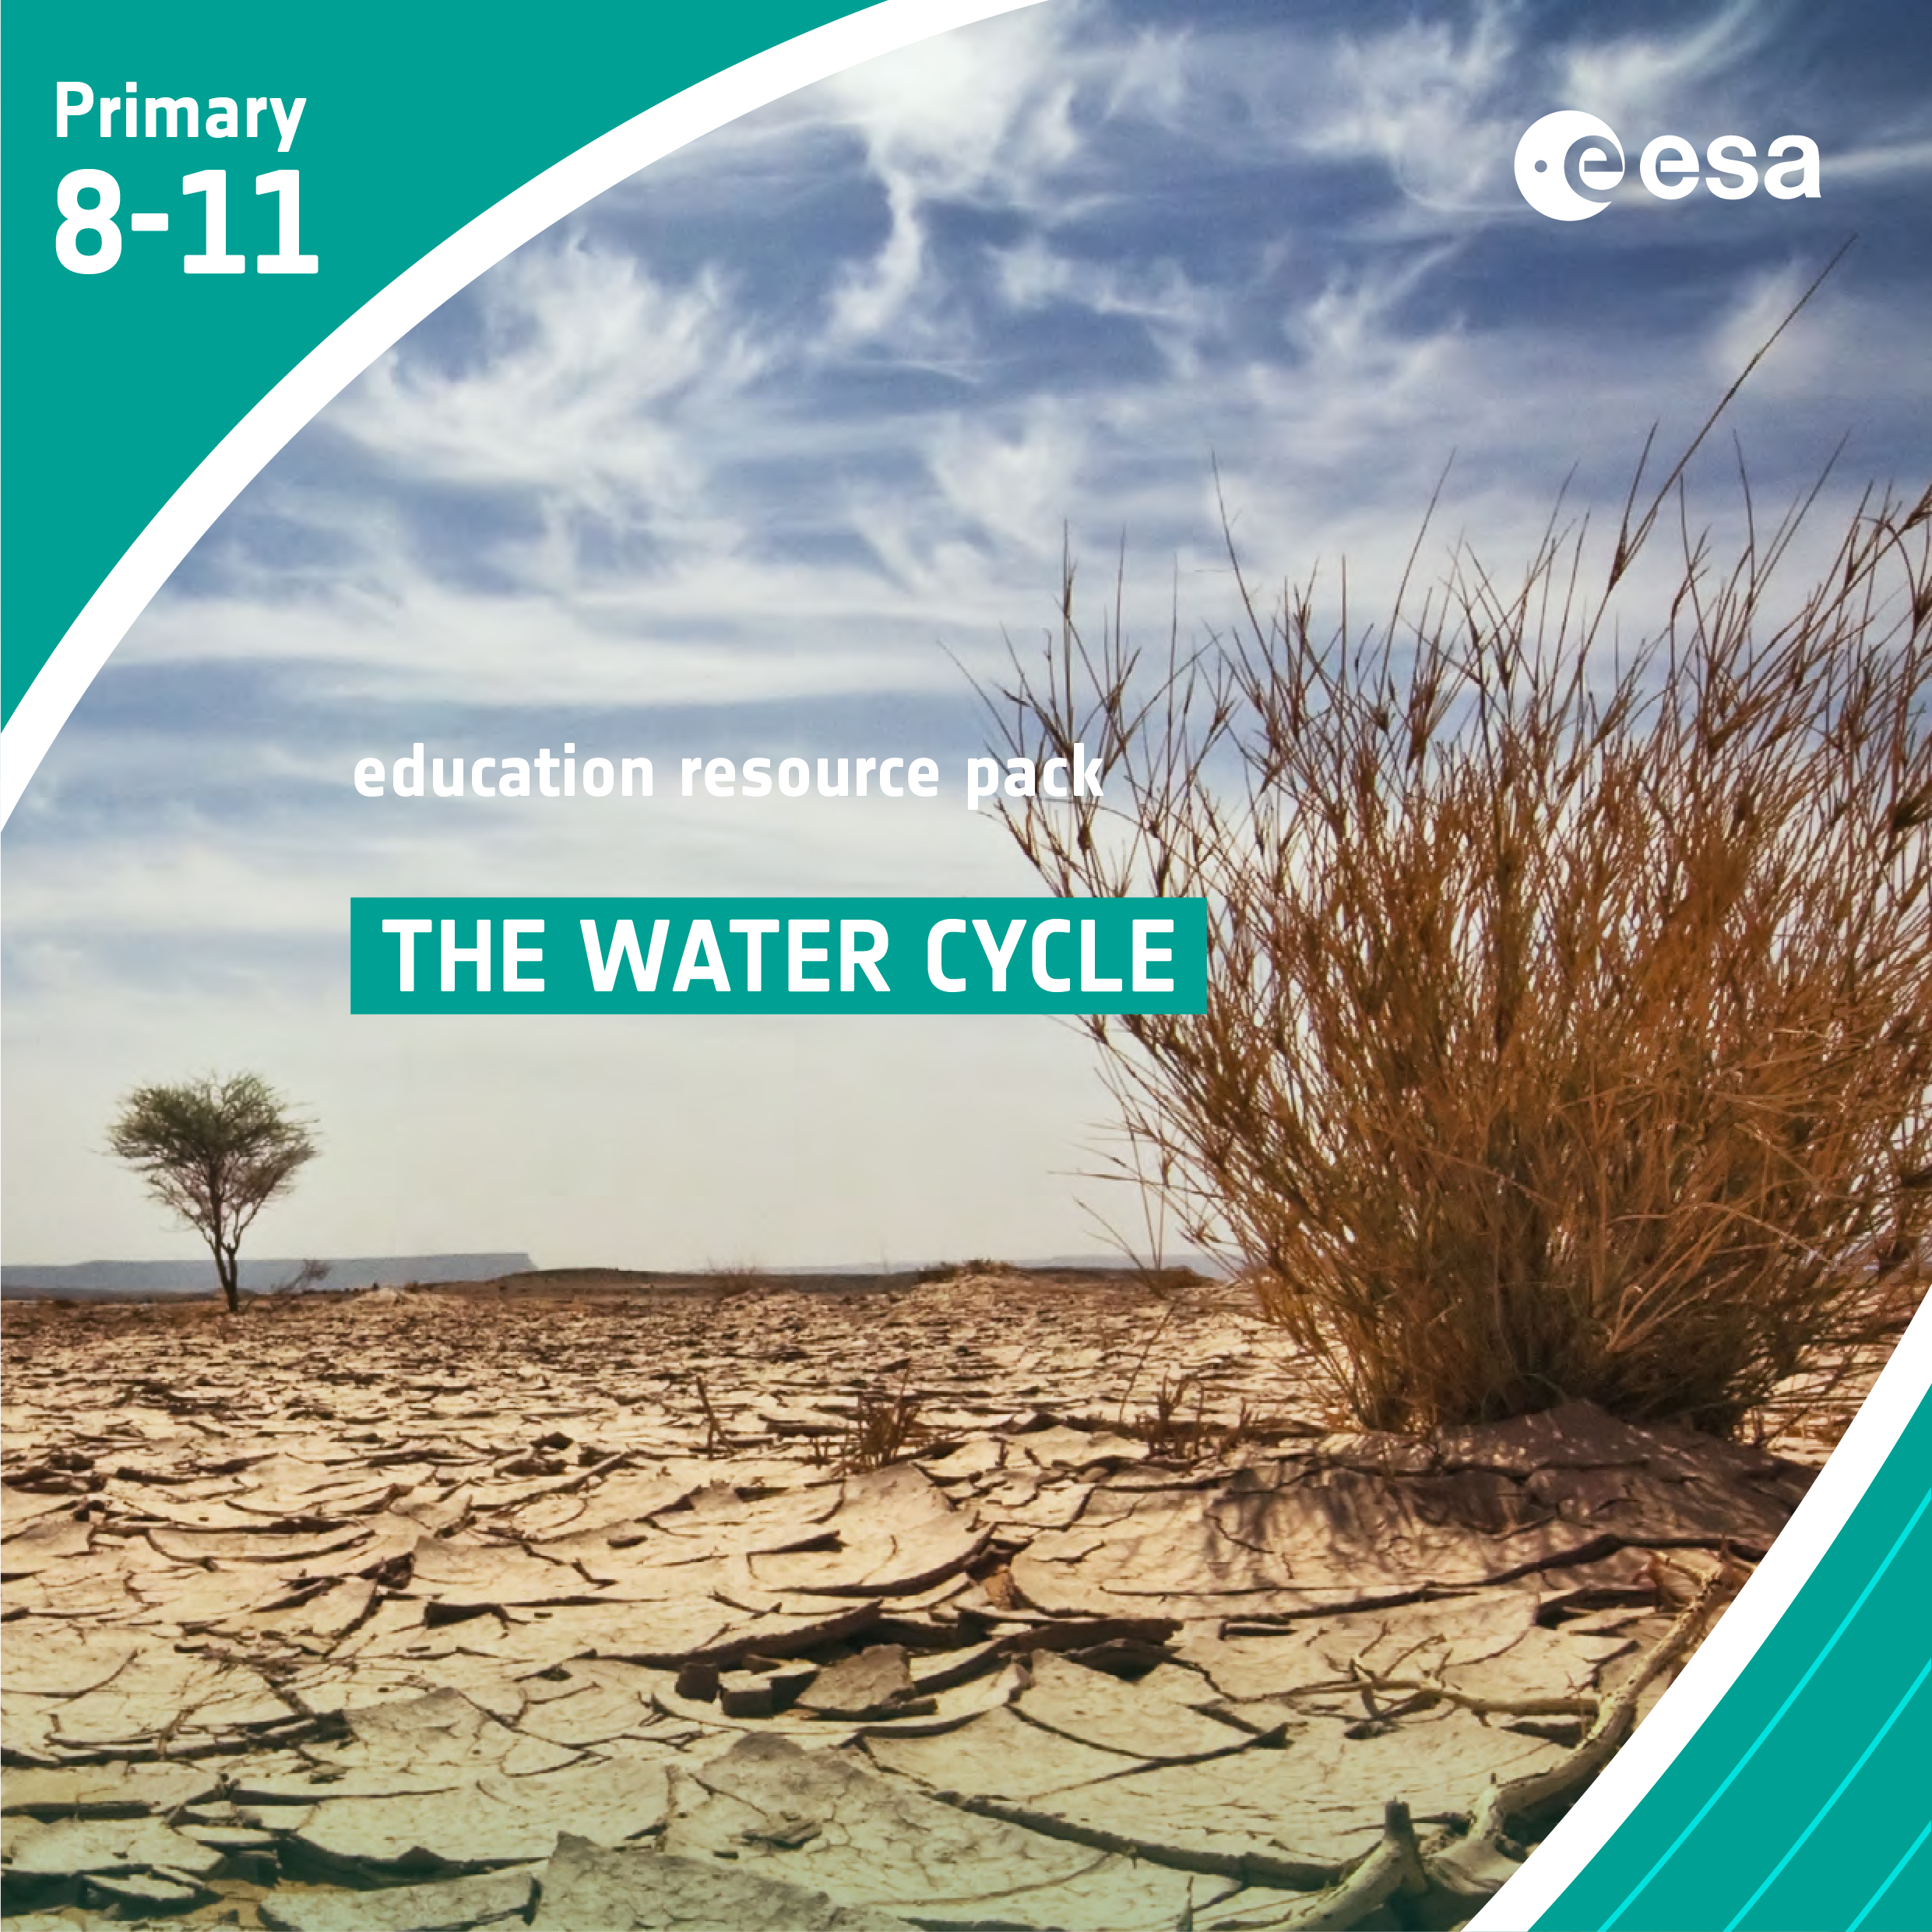
The Water Cycle
Brief description In this set of six activities, students will learn about the water cycle and, in particular, how water...
Copernicus Browser Teacher Guide
Brief description The goal of this guide is to help teachers navigate the main tools of the Copernicus Browser and...