A Passage opens – Arctic sea ice and climate change

Brief description

In this set of three activities, students will discover the important role Arctic sea ice plays in the Earth’s climate system. The activities are set in the context of the Northwest Passage. The first activity is a mathematical investigation into sea ice melt rate to illustrate what is meant by Arctic amplification. A practical investigation provides an opportunity to discuss how models are used in science and consider the difficulties of measuring and predicting the effects of climate change. Students then use the Climate from Space web application to explore seasonal and long-term trends in sea ice extent and sea surface temperatures.

Subject Geography, Earth Science, Physics, Chemistry

Learning Objectives
  • Explain how the differing albedo of ice and ocean leads to Arctic amplification and the impact of this on climate change
  • Use a mathematical model to investigate the effect of different conditions on the melting of sea ice
  • Relate an experimental model to the real world and evaluate the model
  • Analyse images to obtain data on the melting of ice
  • Discuss the challenges of collecting data to describe and predict the effects of climate change
  • Use the Climate from Space web application to explore changes in the Arctic region
  • Relate changes in the seasonal pattern of sea ice extent to changes in sea surface temperatures
  • Suggest reasons for changes over various timescales
Age range
11 – 14 years old
Time
approximately 45 minutes per activity
Resource available in:
Activity 1: How quickly does sea ice melt?
In this activity, students will be introduced to use a brief history of the Northwest Passage to provide a context for exploring the role of sea ice in the climate system. Students are then guided through a calculation using the conservation of energy, the concept of albedo, and latent heat of fusion (with the latter two explained) to develop a mathematical model they can use to explore Arctic amplification.
Equipment
  • Information sheet 1 (2 pages)
  • Student worksheet 1 (2 pages)
  • Climate from Space online resource: Breaking the Ice story (optional)
  • Calculator or/and access to spreadsheet software
  • Graph paper
Activity 2: Ocean temperature and ice melt rate
In this activity, students explore the effect of changing ocean temperatures on the melting of ice using a smartphone or tablet to model a satellite monitoring sea ice. The later parts of the activity are open, providing opportunities for you to assess core scientific and mathematical skills and stretch more able students as they discuss what their investigation reveals about the difficulties of collecting reliable climate data to model change.
Equipment

Each group will need:

  • A beaker, small tray or bowl
  • Three or four beads or buttons of different colours
  • Play dough to fix the markers in place
  • At least three ice cubes or blocks of a similar size made from coloured water
  • Beaker or jug
  • Hot and cold water
  • A thermometer
  • Smartphone or tablet with a camera
  • A stack of books or block of wood to support the phone/tablet
  • A clock or timer (the classroom clock will suffice)
  • Towels for wet hands and to deal with any spills


Students will also need:

  • A copy of Student worksheet 2 (2 pages) for each student
  • Access to image-processing software with which they are familiar
  • Printer (optional)
  • Acetate sheets printed with a grid (optional)
  • Squared paper (optional)
  • Tracing paper (optional) 
Activity 3: The Northwest Passage
In this activity, students will use the Climate from Space web application to explore satellite data on sea ice extent and sea surface temperature and examine annual and long-term trends in the Northwest Passage and across the wider Arctic region. It could be used to reinforce their understanding of key climate processes in the Arctic. Alternatively, you may wish to use it at the start of a topic on climate change or the Arctic as a way of getting students to share their existing knowledge and suggest questions to investigate.

Did you know?

  • The Northwest Passage is about 1900 km shorter than the route via the Panama Canal.
  • Freshly falling snow can have an albedo up to 0.90. This decreases as the snow becomes older and turns into ice crystals.
  • Ice floats because it is less dense than water. This is unusual because most substances are denser when they are solid than when they are liquid.
  • Sea ice concentration can be measured with satellite instruments that detect microwave radiation.
  • A fleet of microwave satellites capable of measuring sea ice concentration has been operational for more than four decades.
  • Many Earth observation satellites are in such orbits that they cannot take measurements directly above the North or South Pole – although they can ‘see’ everywhere else on Earth.

Colour vision

Discover how satellites like Copernicus Sentinel-2 provide a new perspective of Earth’s land and vegetation.

Helping to manage water

Discover how satellites can help collecting information on water resources at over large areas.
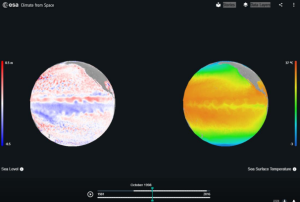
Saving lives when disasters strike

Discover how satellite images can help with disaster relief and recovery anywhere in the world.