Climate Detectives Projects 2021-2022
Project title: Does traffic congestion affect the air quality at Aloha College Marbella
Team: Aloha College Climate Detectives Mark II
Colegio Fundacion Aloha College Marbella Marbella Spain 5 Student’s age: 14-15 years old
Does the number of vehicles affect the air quality (carbon dioxide, ozone and particulates) during peak times of the school day?
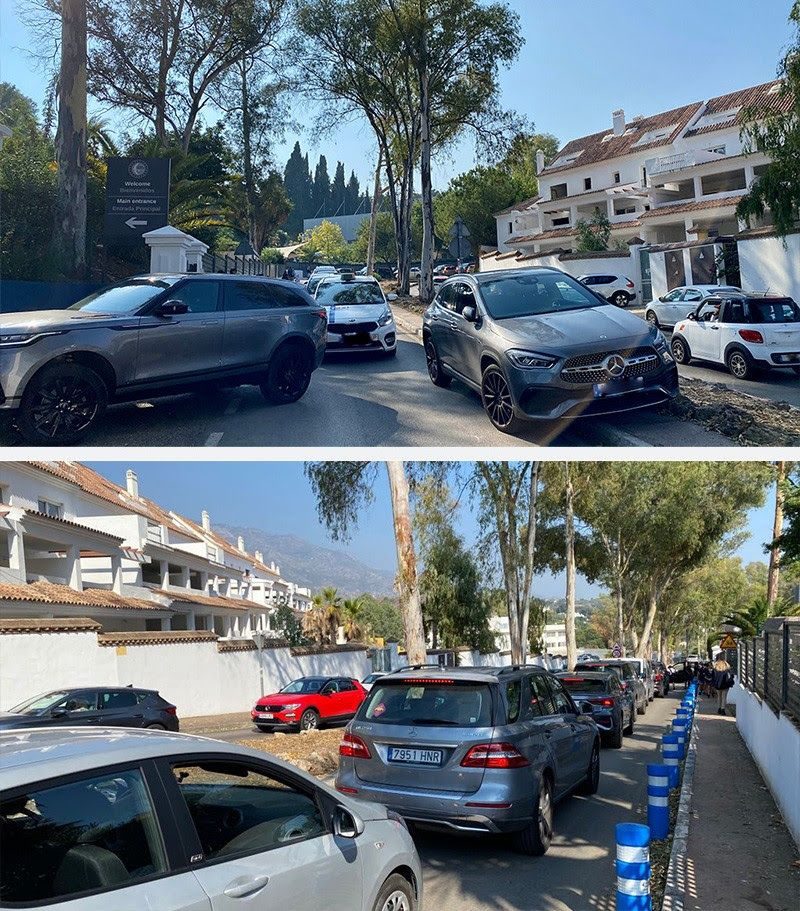
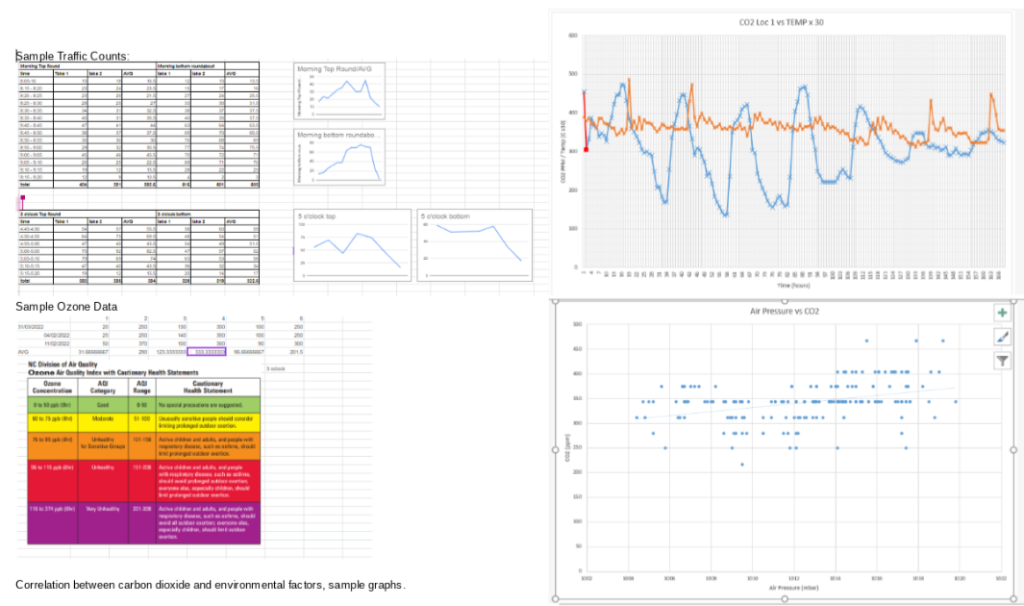
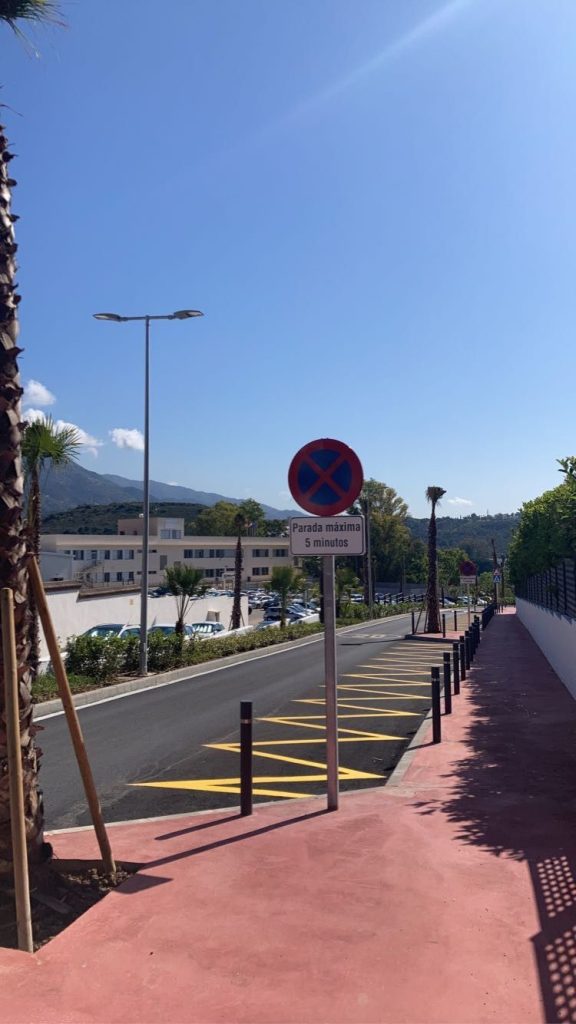
Aloha College Marbella observed a problem with traffic congestion in our school during morning and afternoon rush hours. On the 4th of October of 2021 they sent out an email to all staff and students, presenting their concerns with the traffic. In addition there had been a recent forest fire. This issue raised our team’s awareness about the air quality, worsening climate and we decided to see the impact the school community had on our local area. We investigated the air quality during rush hours and compared our results to times with less traffic. Our team measured carbon dioxide concentrations with a carbon dioxide meter to record the levels during the whole day, we measured ozone levels at different times of day, climate data from the aloha college weather station, amount of cars during rush hours, particulate matter levels with a particulate matter meter. We also sent out a form to the staff and parents of Aloha College to obtain statistics related to their vehicle usage and times and how this could be impacting the air quality around us. The amount of cars during rush hour, correlated to the changing carbon dioxide concentrations along the day. This along with the relatively high ozone levels and high particulate matter, proved how the air quality around the school worsened during rush hour. These results all indicated how our school community has an impact on the air quality and climate and how we need to take action to improve the traffic conditions.
To conclude, in this project we can observe that, from our ozone, traffic counting and carbon particulate results(and also taking into account the survey that was sent out), the air quality around the school varies depending on times and places. In general, the air quality in our garden and green areas of the school are comparatively uncontaminated, however the exit, entry and waiting points have poor observable air quality and being in these locations for prolonged periods could potentially result in cardiac, and breathing difficulties- including asthma.
When analyzing the amount of cars, we can see most of the congestion occurs in the morning and at 4 o’clock as most students and staff enter and leave the school at those hours. Also most of the vehicles go through the bottom roundabout not the top.
Regarding the survey, this is the data we have gathered. 90.5% of the people arriving at the school use cars and only the minority uses other options of transportation such as bicycling, walking or using the school bus. 41.2% of these cars use diesel fuels which has several environmental effects due to the fact that they emit harmful gasses that add to the production of ground level ozone. Only 15.1% use either hybrid or electric cars. To add on we can see that 80.1% do not car share or rarely do.
The ozone concentration levels at the science were good in the AQI range(0 to 59ppb), meaning no special precautions were suggested. This was as predicted earlier, as there are no roads nearby. By the roundabout, where cars are on standby all the time, the ozone concentration was very unhealthy(290ppb), which should be concerning. The cautionary health statement suggests all active adults and children should avoid outdoor exertion. The concentration levels at the top of the sports hall were unhealthy/very unhealthy, also due to the abundance of vehicles. The bottom gate is the busiest zone out of all, which contributes to the air quality; it is the most unhealthy on average(333.3 ppb) in our school. Following that, the garden area concentration was moderate/unhealthy for sensitive groups(97ppb).
On another note, the data we have gathered from the professional carbon dioxide meters can not be directly linked to the traffic itself alone because it fluctuates throughout the day and is multifactorial.

Our research has strongly indicated that there is a significant pollution hazard near roads around the school. The traffic survey has also provided useful information and indicates that the majority of individuals (who responded) are not using their cars in an optimal way to benefit the environment. During the rush hours the amount of cars can be up to 1000 in only a 45 minute period and our observations have also shown that numerous cars stay with their engines running as they wait in the traffic. This has an effect on air quality as passenger vehicles (particularly those that burn diesel fuels) produce high amounts of nitrogen oxides, carbon dioxide and other pollutants. So far our school has provided waiting zones and attempted to inform the school community about the issues. Furthermore, they hope that our data would support their concerns in making the school more eco friendly by decreasing the traffic congestion and have the people in the school use ways of transportation that would better the air quality such as walking or biking if possible, promoting the school bus and encouraging the usage of electric cars. We would also hope to see an increase in participation and interest in the effects they may be having on the environment as only 15% of the people actually filled out our survey and 40% would not even consider car sharing.
Projects are created by the teams and they take the full responsibility of the shared data.
← All projects