Climate Detectives Projects 2021-2022
Project title: Air Pollution and West Derby Schools
Team: Eco Saints
St Vincent’s Liverpool United Kingdom 6 Student’s age: 10-11 years old, 12-13 years old, 14-15 years old

What is the air quality like around West Derby schools and how could we improve it?
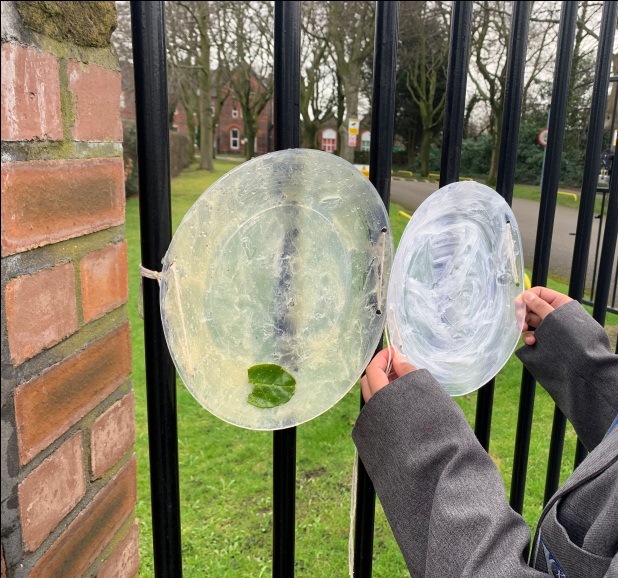
In the area of West Derby in Liverpool, we have a number of primary and secondary schools together in a small area as well as a large children’s hospital. We believe the traffic pollution has an effect on the air quality around our schools. We investigated the traffic around our school and monitored the air quality at different times of the day. We also looked to see whether term time had any effect. We compared our data with Liverpool air quality results from their monitoring station in Edge Lane. The photo shows the vaseline traps that the pupils made before and after 4 weeks at the roadside.
We monitored the traffic outside school at different times of the day, weekends and school holidays to see if this made a difference. We found out that the traffic around our school was significantly higher at peak school drop off and pick up times, sometimes even doubled during these hours. The traffic was also reduced by 100 cars/day at the weekends due to no school runs. School holidays were another significant reduction from term time traffic. This meant that the air quality when pupils were entering and leaving school would be a lot worse than any other time of day.
The pupils made their own Vaseline particulate traps and sited them on the main road outside our school. They were left in situ for a month to collect as much particulate matter and airborne pollution as possible. The photo in the summary above shows the difference in how dirty the plates were due to the traffic pollution. We could also see black specs of particulate pollution from the car exhausts.
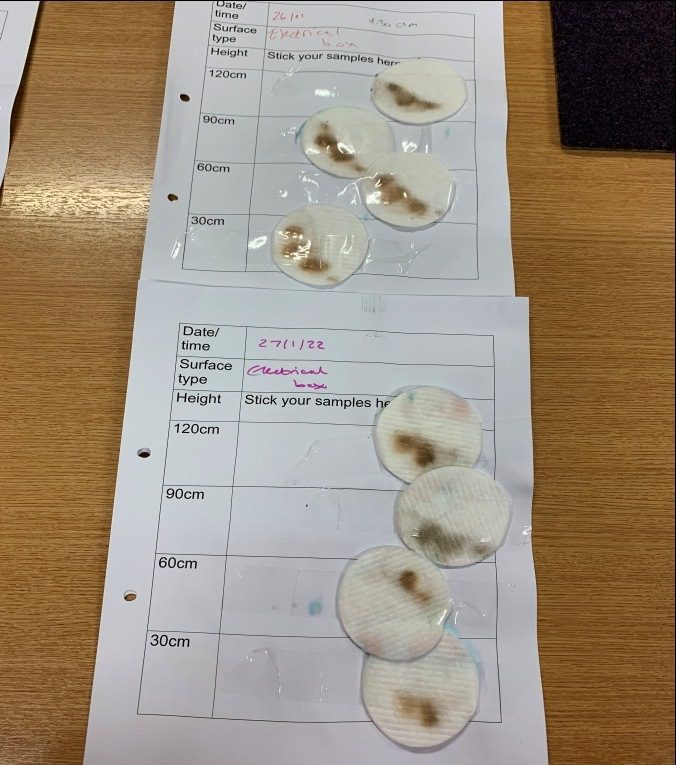
We also took swabs of fixtures on the roadside on consecutive days to monitor how dirty they became. We were very surprised at the levels of dirt on the fixtures at the roadside. We cleaned a bus stop facing away from road so that it could not be dirt from spray off the wheels and it was completely dirty again just one day after. This indicated how much pollution was in the air for this to build up so quickly.
We also looked at data collected from the Liverpool air quality monitoring station in Edge Lane. The graphs generated from their data also corroborated our findings.
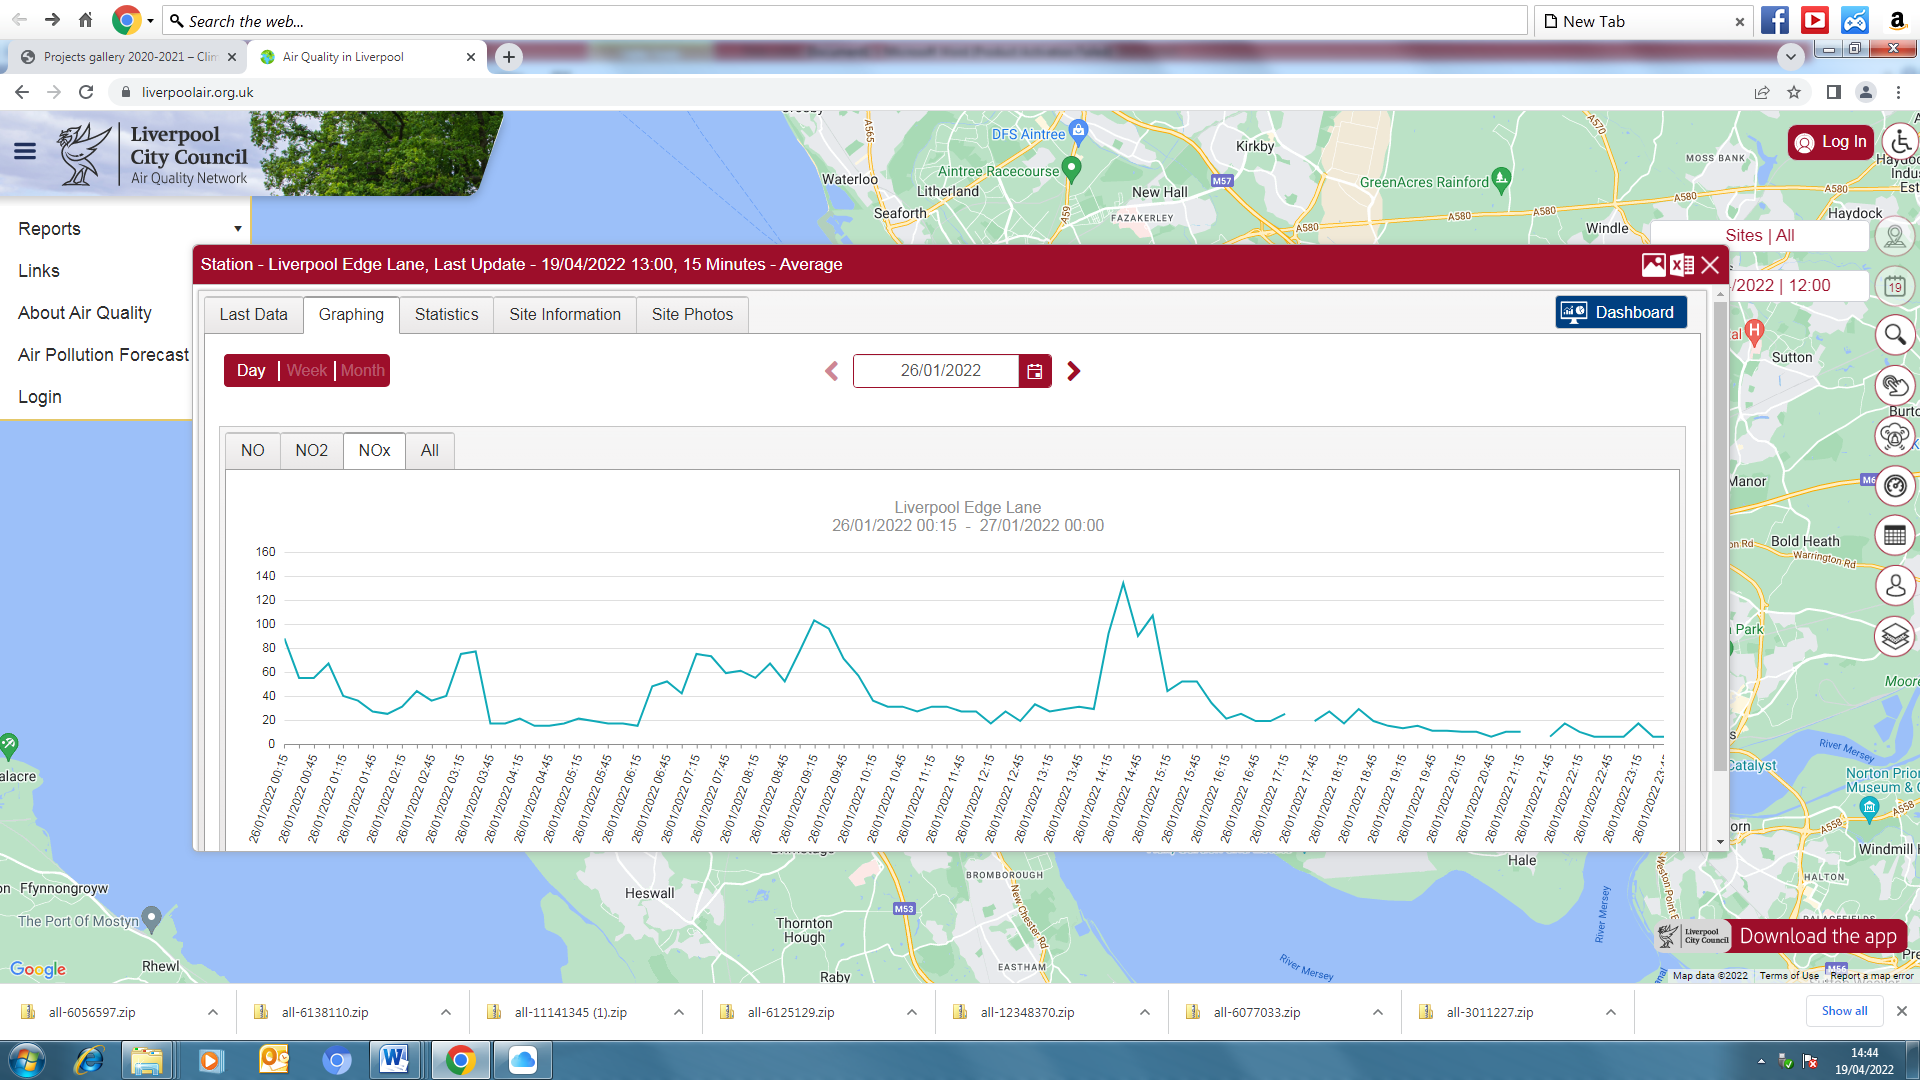
We believe that the solution to our air quality would be to reduce the no of cars on the road particularly during the school day. The graph from the air quality monitoring station shows the effect around school start and finish times. Pupil walking into school will be breathing in all these traffic fumes and particulates without even knowing the damage it can cause.
We conducted a survey in our school to ask parents and teachers what are the barriers to travelling to school by cycling, walking or public transport. We found out that walking and cycling were made more difficult by the lack of cycle lanes and safe routes to travel. Parents were concerned at their children’s safety due to the amount of cars on the road.
We contacted the local council to discuss infrastructure changes to make cycling or walking a safe and realistic choice for us and the two other large secondary schools in our immediate vicinity.
Projects are created by the teams and they take the full responsibility of the shared data.
← All projects