Project title: The hidden poison of combustion gases: SMOGBUSCHOOL
Team: SMOGBUSCHOOL
IES Martín Rivero Ronda Spain 6 Student’s age: 14-15 years old
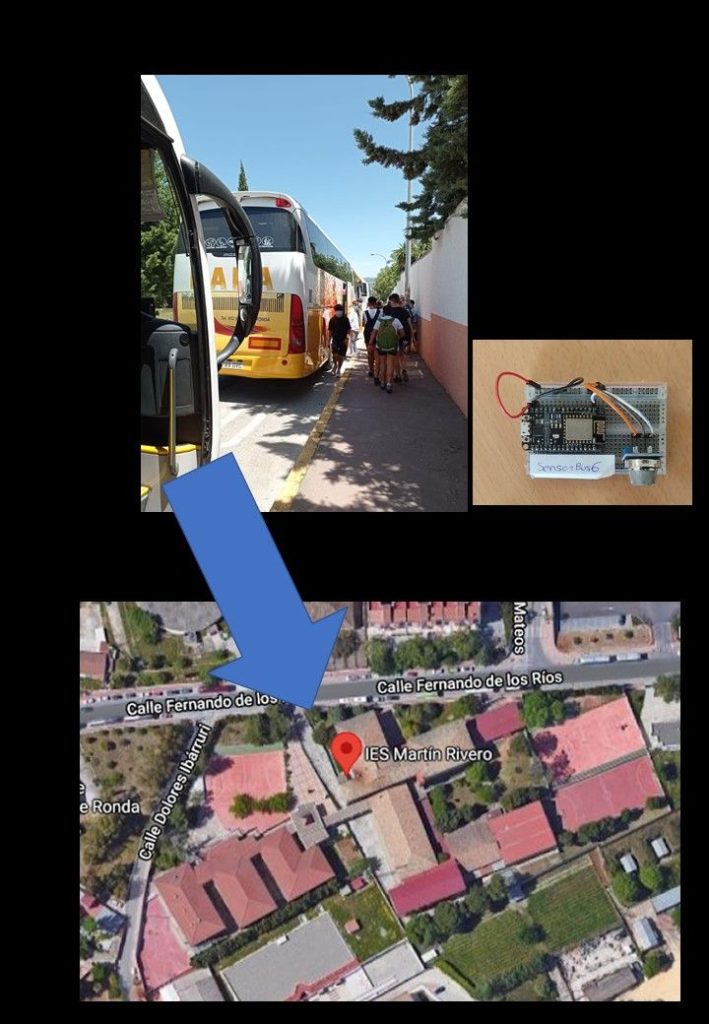
Our educational center has more than 20 buses at the door to pick us up and take us home. Is the level of gases they emit adequate?

Heavy vehicles emit a high number of pollutants, including PM, VOC, NOx, CO, CO2, SO2 and O3, all of which are very harmful to our health, even in minute proportions, so the accumulation of vehicles at the outlet of institutes can be a general problem for the health of students and teachers. This research aims to measure the impact of these vehicles on the atmosphere and, in parallel with the same sensors measure these polluting gases in other places that can affect people’s health: a) A new bus station near another educational center
b) The underground parking of a large supermarket on vacation days
c) in the room of students located in streets more or less traveled by heavy vehicles.

For carry out this investigation, we have used some materials: Portable batteries, Mobile and computer, Reused milk cartons, USB Cable. Now, we are going to show and explain the most important material, which is the analogical sensor, this is because it has only one cable which must send information. If the sensor where digital, it should have 2 cables to send information
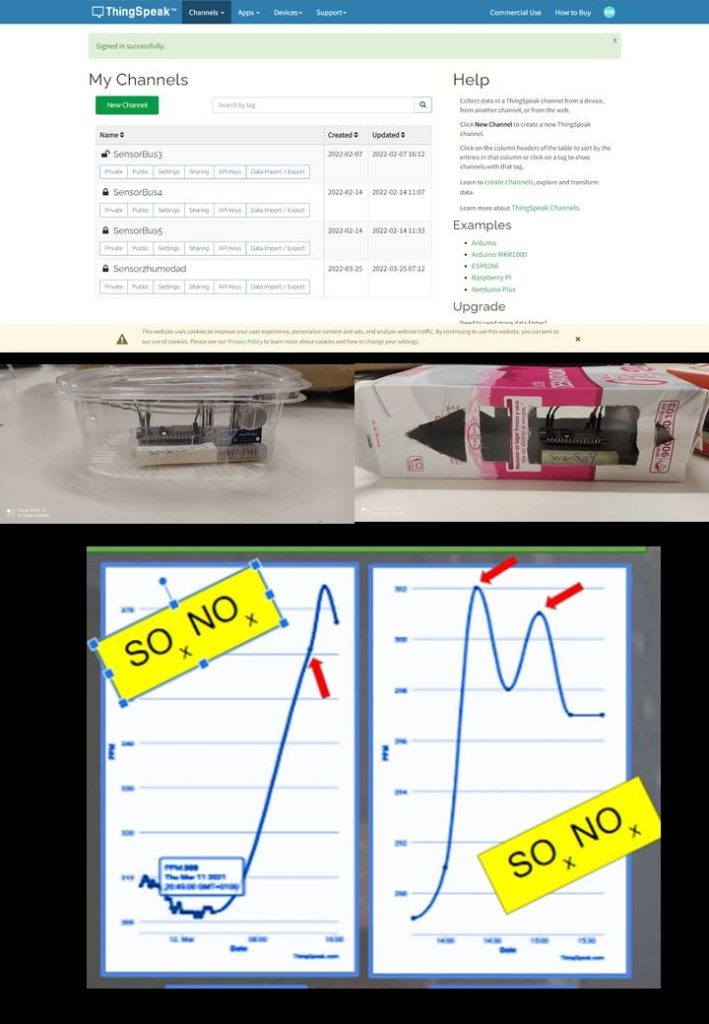
These sensors have a filter which recognizes different gasses and that information is sent to a microprocessor which is the part of the sensor that sends the information to the internet. The analogic gas sensors send us the information to our phones or computers, we receive this information thanks to the “ThingSpeak” application and with that information we make graphics.
We have results in the door of IES Martín Rivero. Then, I am going to show our graphics, which we have obtain thanks to “google spreadsheets”:
Before anything, we are going to give the small information necessary to understand our graphics. In the X axis we have put the time when we measure and in the Y axis we have put the particles that there are in the air. Unit of measurement we use in the Y axis is PPM, ergo, parts per million. In these graphics, we can see that three graphics start from below, in those moments, the bus hasn’t arrived yet. We can see an increase when the bus arrives at the door of the high school, too. When the bus leaves the graphics suffer a decline.
With these results, we have determined that the gasses of the bus are harmful for us. We are still working to get the results of the rest of our objectives.
Finally, we had a purpose, apart from those mentioned above, we are going to devise some steps. For now, we have thought of two steps for this problem.The following steps are which we have already thought up:
The bus mustn’t start the engine until the students will be in the bus. This is because the gasses start to increase before the people go out of the highschool and this is because the engines start earlier.
We should put sensors in the future bus station to control its gasses. this is just for analyze the results with the old bus station.
Projects are created by the teams and they take the full responsibility of the shared data.
← All projects


