Project title: Drought risk and water quality in Chiclana (Cádiz, Spain)
Team: Detectives Clima HÉRCULES LPS CD School Award
IES Ciudad de Hércules Chiclana de la Frontera Spain 10 Student’s age: 14-15 years old
Is there a relationship between climate change, variations in water quantity and quality in the Los Hurones reservoir, soil moisture and the water stress of the vegetation in Chiclana?

We have structured our project into two different sections.
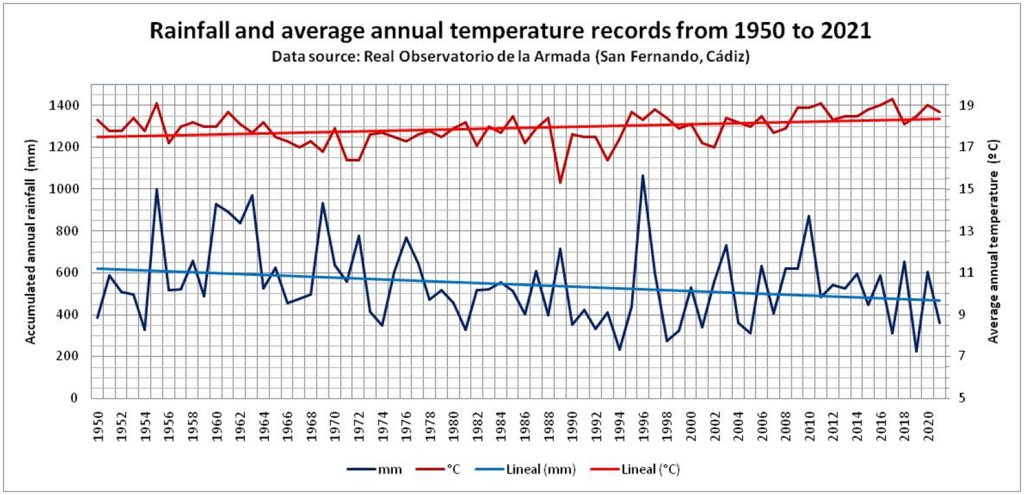
In the first section, we conducted a study on the evolution of rainfall and temperature in the local environment. As we do not have reliable meteorological data from Chiclana, we have used historical records from San Fernando (7 km from Chiclana) provided by the Royal Astronomical Observatory of the Navy, an institution that collaborates with the Spanish Meteorological Agency. Using this data, we have created and analyzed various graphs on the evolution of the annual averages of precipitation and temperature since 1950 and the trends of the monthly averages from 2000 to the present date.
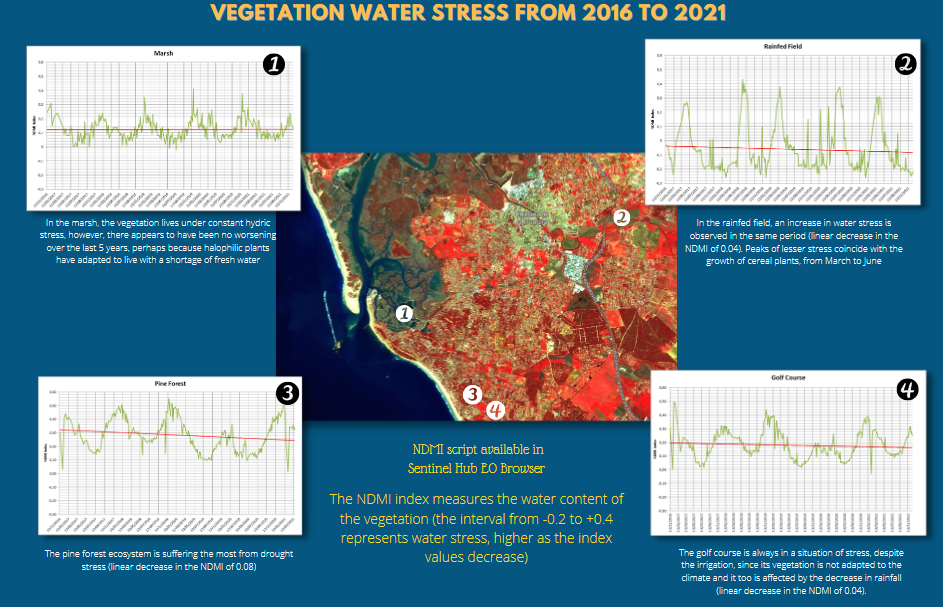
In the second section, we have analyzed soil moisture in four different ecosystems (golf course, pine forest, marshes and dry land) in our town from 2016 to 2021. We have used the NDMI script (Normalized Difference Moisture Index) available in Sentinel Hub EO Browser applied to images from a Sentinel-2 satellites. With the data collected in the different locations, we have been able to create four graphs on the variation of the humidity index, observe the trend in the last five years and draw conclusions about the water stress of the vegetation in our municipality.
Due to a lack of time, we have not been able to address the objective related to the analysis of the quantity and quality of water in the Los Hurones reservoir. We reserve this aspect for future research.

— RAINFALL AND TEMPERATURE RECORDS period 1950-2021
Using a linear approximation, the trend over the last 72 years demonstrates a decrease in annual rainfall by about 150 mm and an increase in the average annual temperature by 0.9 ºC.
Regarding the analysis of the monthly records since the year 2000, the graphs seem to indicate that the period from September to December is getting increasingly warmer (also May, although less noticeably). This would signify an extension of summer in the place of what was mainly autumn and, to a lesser extent, spring. We do not detect significant changes in temperatures in the summer and winter.
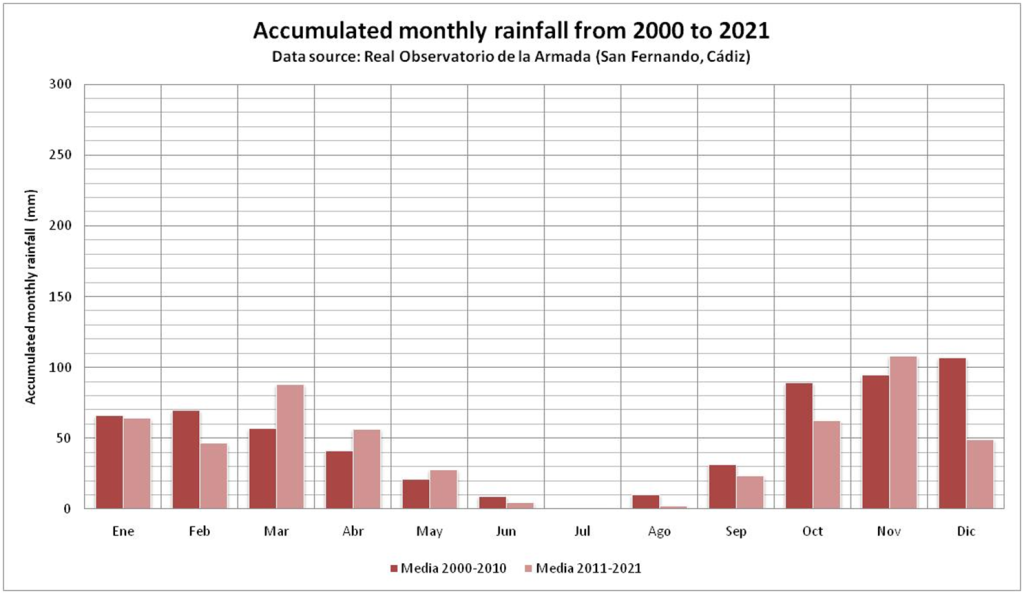
In reference to the monthly accumulated rainfall, we observe a decrease in rainfall, especially in February, September, October and December. On the other hand, rainfall increases in March and, less significantly, in April.
— VEGETATION WATER STRESS period 2016-2021:
The NDMI index measures the water content of the vegetation (the interval from -0.2 to +0.4 represents water stress, higher as the index values decrease).
In the marsh, the vegetation lives under constant hydric stress, however, there appears to have been no worsening over the last 5 years, perhaps because halophilic plants have adapted to live with a shortage of fresh water.
In the rainfed field, an increase in water stress is observed in the same period (linear decrease in the NDMI of 0.04). Peaks of lesser stress coincide with the growth of cereal plants, from March to June.
The pine forest ecosystem is suffering the most from drought stress (linear decrease in the NDMI of 0.08).
The golf course is always in a situation of stress, despite the irrigation, since its vegetation is not adapted to the climate and it too is affected by the decrease in rainfall (linear decrease in the NDMI of 0.04).

Our research on the risk of drought in our environment has led us to organize a “Climate Activists” group in which we are developing various actions:
1. Dissemination of the conclusions of our research together with a series of podcasts that we have prepared on pollution and its different aspects (atmospheric, acoustic, light, etc.):
* Publication of the results of our project on our institution’s website to inform the entire educational community, including families.
* Presentation of our work at the “Chiclana Science Fair” (from May 25 to 27, 2022).
* Exhibition of our findings at the “Science and Humanities Week” of our institution (from May 1 to 6, 2022).
* Participation in a workshop organized by an ecological consumption group in Chiclana, “El Semillero”.
* Communication with the Royal Observatory of San Fernando on our conclusions obtained using the historical meteorological records and with the city councils of San Fernando and Chiclana so that they may publish our findings on their websites.
2. Preparation of surveys for older people from the Chiclana countryside on their observations in regard to and opinions on climate change. These findings will be presented in a video that will be released along with the podcasts and findings of the climate researchers.
3. Proposal to the leadership of our institution to install a system for harnessing solar energy on the roof of our center to serve as a reference for students and families on sustainable energy production.
https://ciudaddehercules.es/index.php/detectives-del-clima/detectives-del-clima/
Projects are created by the teams and they take the full responsibility of the shared data.
← All projects


