Climate Detectives Projects 2022-2023
Project title: Coastal erosion in the Bay of Santander
Team: Castroverde D
C. Tetuán, 47 Santander Spain 4 Student’s age: 14-15 years old
Is Santander’s coastline eroding due to global warming?
¿Se está erosionando la costa de Santander debido al calentamiento global?
This project consists of analysing the waves on the coast of Santander over 65 years (1958-2022), in order to observe how global warming has affected coastal erosion. To do this, we are going to analyse the size of the waves and storms.
We carried out this study because our city, Santander, is a coastal city, and we have observed that there is more erosion in coastal areas.
We think it could be due to global warming. To check this we are going to analyse the size of the waves, using a buoy located on the coast of our city, which will collect the data (size of the waves), which we will then analyse.
We started this work the week of the 24th of April and worked on it until the 3rd of May. First, we obtained the necessary data from the harbour’s website, obtained with a buoy, which was located between Somo and the Magdalena Peninsula.
Este proyecto consiste en analizar el oleaje de la costa de Santander a lo largo de 65 años (1958-2022), para observar cómo ha afectado el calentamiento global en la erosión de las costas. Para esto, vamos a analizar el tamaño de las olas y los temporales.
Este estudio lo realizamos, porque nuestra ciudad, Santander, es una ciudad costera, y hemos observado que hay más erosión en las zonas de costa.
Pensamos que podía ser debido al calentamiento global. Para comprobarlo vamos a analizar el tamaño de las olas, utilizando una boya situada en la costa de nuestra ciudad, que recogerá los datos ( tamaño de las olas ), que posteriormente analizaremos.
Este trabajo le comenzamos la semana del 24 de abril, y lo trabajamos hasta el 3 de mayo. Primero, obtuvimos los datos necesarios mediante la página web del puerto, obtenidos con una boya.Esta estaba situada entre Somo y la Península de la Magdalena.
We analyse the results obtained in winter.
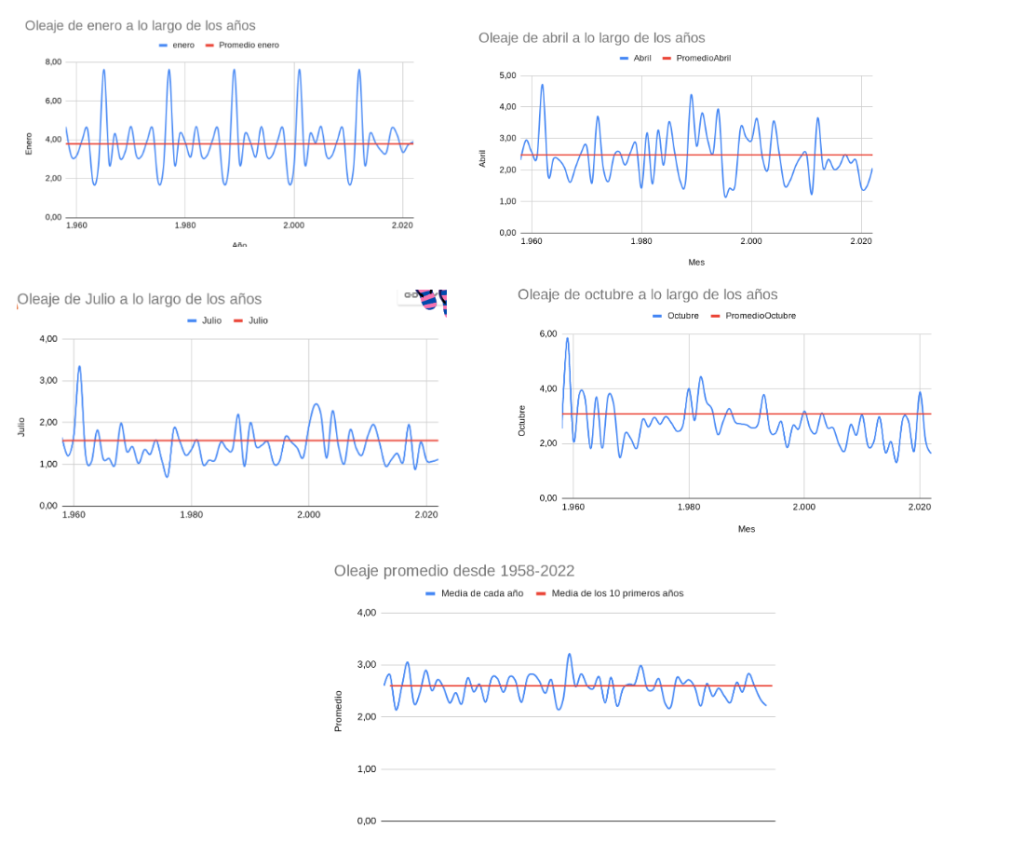
The most representative month and the one on which we carried out the study is January. We can see that there is an irregular graph with many peaks. The lowest recorded figure is 1.82 m (1987), and the highest is 7.62 m (2012). This difference in wave size is due to storms. Global warming is affecting the number of storms.
As for the results obtained in spring, we analysed the month of April and observed that the number of storms has increased compared to the winter. Waves reached up to 4.38 metres (1989), while the minimum value recorded was 1.24 metres (2011).
When looking at the summer, we chose July.
We note that there have been hardly any storms. The size of the waves is below average most of the time. In the table, the lowest recorded figure was 0.72 metres in 1976, and the maximum value was in 1961, with a height of 3.35 metres.
Finally, in autumn, we looked at the month of October.
The storms begin to increase little by little, and except in the event of a storm, the swell is below average. When analysing the data, we have seen that the highest recorded figure was 5.85m in 1959, and the lowest was 1.32m in 2016.
We have come to the following conclusion:
We believe our hypothesis is correct. Over the years, storms have progressively increased, and our coastline is eroding.
Analizamos los resultados obtenidos en invierno.
El mes más representativo y sobre el que realizamos el estudio es enero. Vemos que hay una gráfica irregular con muchos picos. El menor dato registrado es 1,82 m (1987), y el mayor es de 7,62 m (2012). Esta diferencia en el tamaño de las olas, es debido a los temporales. El calentamiento global está afectando al número de temporales.
En cuanto a los resultados obtenidos en primavera, analizamos el mes de abril, y observamos, que el número de temporales ha aumentado, en relación con el invierno. Las olas llegaron a alcanzar los 4,38 metros (1989), en cambio, el valor mínimo que se registró fue de 1,24 metros (2011).
Al analizar el verano, elegimos el mes de julio.
Observamos que apenas ha habido temporales. El tamaño de las olas está por debajo de la media, la mayoría del tiempo. En la tabla realizada, el menor dato registrado fue en 1976 de 0,72 metros, y el valor máximo fue en 1961, con 3,35 metros de altura.
Por último, en otoño, hemos analizado el mes de octubre.
Los temporales comienzan a aumentar poco a poco, y salvo en caso de temporal, el oleaje está por debajo de la media. Al analizar los datos hemos visto, que el mayor dato registrado es de 5,85 m en 1959, y el menor, es de 1,32m en 2016.
Hemos llegado a la siguiente conclusión:
Nuestra hipótesis creemos que es correcta. A lo largo de los años, los temporales han ido aumentando progresivamente, y nuestra costa se está erosionando.
Global warming is affecting coastal erosion, and increasing storm surges. In order to reduce this, we can collect signatures to come to a healthier and more sustainable agreement, such as instead of generating electricity through fossil fuels, use wind energy, hydro energy etc. Also, avoid excessive deforestation.
On the other hand, we can avoid travelling by plane, which is the transport that generates the most greenhouse gas emissions, or by private car, but instead we can use public transport such as the train.
Another thing we can do is to minimise online shopping.
We can also disseminate the work, so that more people know about the problem, and help us to change it.
El calentamiento global está afectando a la erosión de las costas, y al aumento de los temporales. Para poder reducir esto, podemos recoger firmas para llegar a un acuerdo más sano y sostenible, como en vez de generar electricidad a través de combustibles fósiles, utilizar energía eólica, hidráulica etc. También, evitar la excesiva deforestación.
Por otra parte, podemos evitar desplazarnos en avión ya que es el transporte que más emisiones de efecto invernadero genera, o en coche particular, en cambio, podemos utilizar el transporte colectivo como el tren.
Otra cosa que podemos hacer es minimizar la compra por internet.
También podemos difundir el trabajo, para que más gente conozca el problema, y nos ayuden a cambiarlo.
This project was automatically translated into English.
Projects are created by the teams and they take the full responsibility of the shared data.
← All projects