Climate Detectives Projects 2022-2023
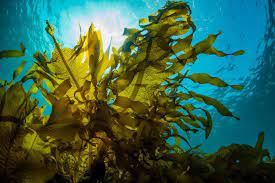
Project title: STUDY OF THE VARIATION OF THE BROWN ALGAE POPULATION IN THE CANTABRIAN SEA AS A CONSEQUENCE OF GLOBAL WARMING.
Team: Castroverde C
C. Tetuán, 47 Santander Spain 8 Student’s age: 14-15 years old
How is the rise in sea temperature affecting the brown algae population in the Bay of Biscay?
¿Cómo está afectando el aumento de la temperatura del mar a la población de algas pardas en el Cantábrico?
Due to the global warming that is taking place, we have wondered whether the population of brown algae in the Cantabrian Sea is being affected. We think that as the water temperature increases and as they are sensitive to temperature changes, the optimum growth range of this species decreases (its optimum temperature for reproduction is 15-18 ºC) and therefore decreases. And we believe that they are important because they have numerous applications (textile, food, etc.) and are a major primary producer in marine ecosystems.
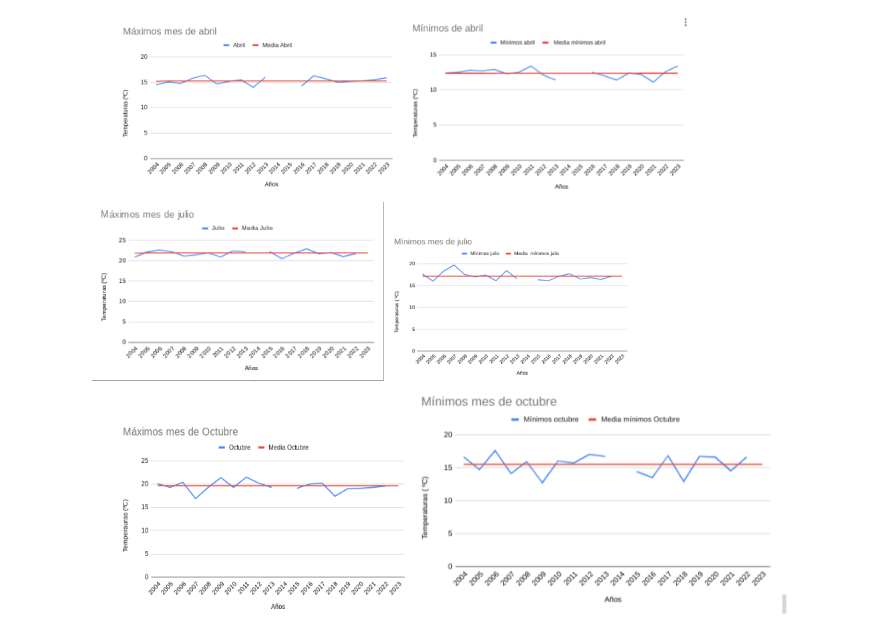
To carry out this research we have used quantitative data, represented in graphs of the maximum and minimum sea temperatures recorded by the Gijón buoy from 2005 to 2023, which we have obtained from the website of the Ports of the Spanish government. https://www.puertos.es/es-es/oceanografia/Paginas/portus.aspx
(Accessed 24-25 April 2023)
Debido al calentamiento global que se está produciendo, nos hemos planteado si la población de algas pardas en el mar Cantábrico se está viendo afectada. Pensamos que al aumentar la temperatura del agua y al ser sensibles a los cambios de temperatura, disminuye el rango de crecimiento óptimo de esta especie (su temperatura óptima para su reproducción son 15-18 ºC) por tanto disminuye. Y creemos que son importantes ya que tiene numerosas aplicaciones (textil, alimenticia, etc.) y son un gran productor primario en los ecosistemas marinos.
Para realizar esta investigación hemos utilizado datos cuantitativos, representados en gráficas de las temperaturas máximas y mínimas del mar registradas por la boya de Gijón desde 2005 hasta 2023 que hemos obtenido de la página de los Puertos de Estado del gobierno de España. https://www.puertos.es/es-es/oceanografia/Paginas/portus.aspx
(Consultado el 24-25 de abril del 2023)
The following results were obtained:
The average for the years 2005-2023 is used as a reference.
Until 2010 temperatures are around the established average (12ºC), from that year onwards temperatures are decreasing. From 2022 onwards, temperatures rise again.
Summer: The temperature is around 22ºC, which is quite high. It has almost no irregularities. In 2006 it drops suddenly to almost 20ºC and in 2008 it rises again to 23ºC.
Autumn: Temperatures are quite high, around 20ºC. It does not drop below 15ºC and does not go above 23ºC. It has many irregularities, in 2007 the temperature drops suddenly reaching almost 15ºC. In 2011 the temperature rises again, reaching 23ºC. In 2018 the same thing happened again as in 2007.
Winter: Temperatures hover between 10ºC to 15ºC, lower temperatures compared to the previous ones. In 2006 and 2015 the temperature rises suddenly. Between 2007 and 2010 temperatures remain low and in 2022 they rise again unexpectedly.
After observing the data obtained, we have concluded that there has not been a sustained rise in temperature in the Cantabrian Sea, so we do not believe, nor can we be sure, that the rise in ocean temperature is affecting the decline in the brown algae population.
In addition, the growth of brown algae is seasonally modified due to the varying sea temperatures in certain seasons. In summer and autumn the growth of brown algae will be normal, as temperatures are around 20ºC, which is the ideal temperature for them to grow. On the contrary, in winter and spring the brown algae will have more difficulties to grow and develop as the temperatures are lower compared to the sea temperature in summer.
Se han obtenido los siguientes resultados:
La media de los años 2005-2023 la usamos como referencia.
Hasta el 2010 las temperaturas están alrededor de la media establecida (12ºC), a partir de ese año las temperaturas van bajando. A partir del 2022 vuelven a subir las temperaturas.
Verano: La temperatura ronda los 22ºC, es una temperatura bastante alta. Casi no tiene irregularidades. En el 2006 baja de manera repentina alcanzando casi los 20ºC y en 2008 sube de nuevo los 23ºC.
Otoño: Las temperaturas son bastante altas, alrededor de los 20ºC. No llega a bajar a los 15ºC y no pasa de los 23ºC. Tiene muchas irregularidades, en el 2007 la temperatura baja repentinamente alcanzando casi los 15ºC. En el 2011 la temperatura sube de nuevo alcanzando los 23ºC. En el 2018 vuelve a ocurrir lo mismo del 2007.
Invierno: Las temperaturas rondan entre 10ºC a 15ºC, temperaturas más bajas comparando con las anteriores. En el año 2006 y en el 2015 sube la temperatura repentinamente. Entre el 2007 y el 2010 se mantienen las temperaturas bajas y en el 2022 vuelve a subir inesperadamente.
Tras observar los datos obtenidos, hemos concluido que no ha habido un ascenso mantenido de temperaturas en el Mar Cantábrico, por lo que no creemos, ni podemos asegurar que el ascenso de la temperatura del océano esté afectando al descenso de la población de las algas pardas.
Además, el crecimiento de las algas pardas se vé modificado estacionalmente debido a la temperatura variada del mar en ciertas estaciones. En verano y otoño el crecimiento de las algas pardas será normal, ya que las temperaturas rondan los 20ºC, temperatura ideal para que estas crezcan. Al contrario, en invierno y primavera las algas pardas tendrán más dificultades para crecer y desarrollarse ya que las temperaturas son más bajas comparando con la temperatura del mar en verano.
Based on the study carried out, we did not observe a very significant increase in the temperature of the Cantabrian Sea, which does not mean that this is not a real problem and that it is not affecting other places globally to a greater extent.
Here are some ideas on how to solve it:
– Awareness raising and sensitisation of adults on this issue, because it is something that is being instilled in children in schools, but it is older people who have a greater impact on the aforementioned problems of global warming.
– Reduction of disposable items, especially plastics.
– Use of electric cars, as oil is very harmful to the ecosystem and the planet. In addition, use public transport or other non-polluting means of transport such as bicycles.
– In cities, services should be distributed in such a way that in each area there is everything necessary so that people do not need to travel by car in their daily lives.
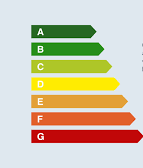
Develop a regulation to establish an “eco-scale” from A-E, where A means that the product has a very low environmental impact and E means that the product has a high environmental impact, similar to the energy efficiency scale for household appliances, but for all the products you buy (food, toys, clothes, etc.).
En base al estudio realizado, no observamos un aumento muy significativo de la temperatura del Mar Cantábrico, lo cual no significa que esto no sea un problema real y que no esté afectando en mayor medida a otros lugares a nivel global.
Aquí dejamos algunas ideas para solucionarlo:
– Concienciación y sensibilización a los adultos sobre este tema, porque es algo que desde los colegios se está inculcando a los niños pero las personas más mayores son las que tienen un mayor impacto en los problemas ya mencionados del calentamiento global.
– Reducción de objetos desechables, especialmente de plásticos.
– Uso de coches eléctricos, ya que el petróleo es muy perjudicial para el ecosistema y para el planeta. Además, utilizar el transporte público u otros medios de transporte no contaminantes como las bicicletas.
– En las ciudades los servicios deberían estar distribuídos de modo que en cada zona haya todo lo necesario para que las personas no necesiten desplazarse en coche en su día a día.
Elaborar una normativa para establecer una “ecoescala” desde la A-E, siendo A que tiene muy poco impacto medioambiental ese producto y E que tiene un gran impacto medioambiental, parecida a la escala de eficiencia energética que tienen los electrodomésticos, pero para todos los productos que compres (alimentos, juguetes, ropa, etc.)
This project was automatically translated into English.
Projects are created by the teams and they take the full responsibility of the shared data.
← All projects