Climate Detectives Projects 2022-2023
Project title: Cantabria and its coast
Team: Los Cántabros
I.E.S Villajunco Santander España 19 Student’s age: 14-15 years old

Will some of Cantabria’s beaches disappear?
¿Desaparecerán algunas de las playas de Cantabria?
In the face of climate change, we have set out to find out what variations in temperature and humidity have occurred in our immediate environment. Knowing that the change in these variables affects the level of our seas and oceans, we are concerned about the possibility that in the not too distant future the beaches of our coasts may disappear.
Three different lines have been followed to obtain the necessary data:
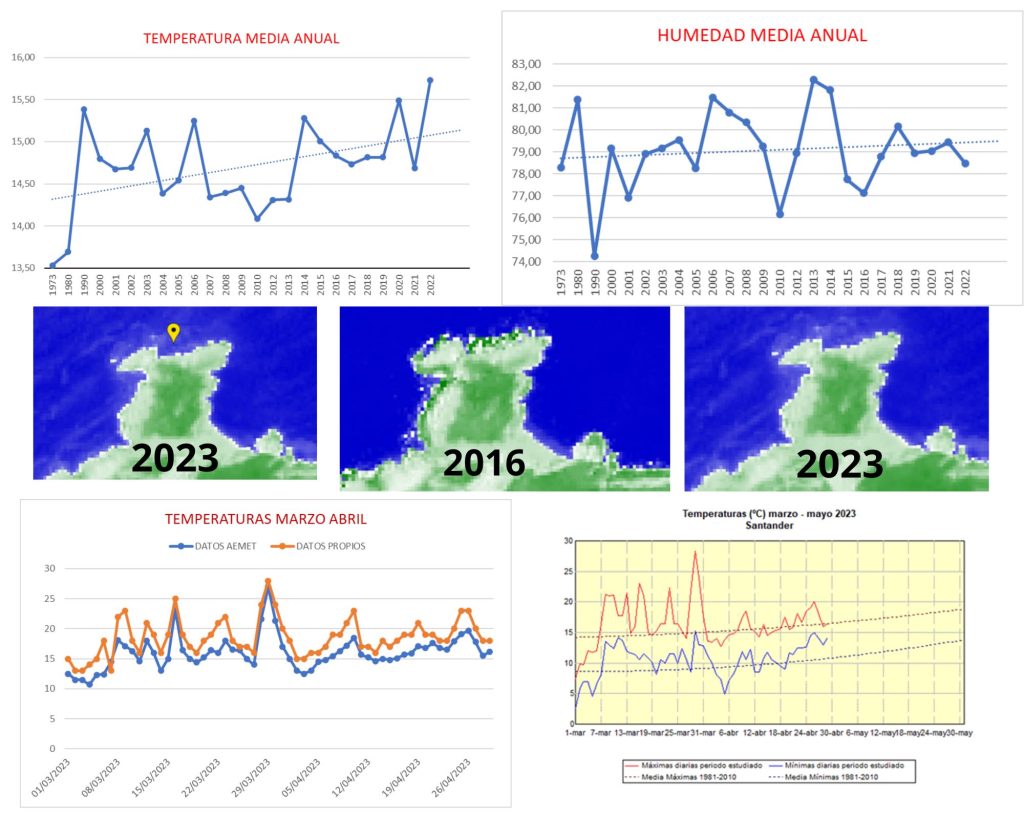
– Collection of temperature and humidity data over the last few decades by consulting the archives of the State Meteorological Agency. The data obtained were used to produce graphs showing the evolution over time.
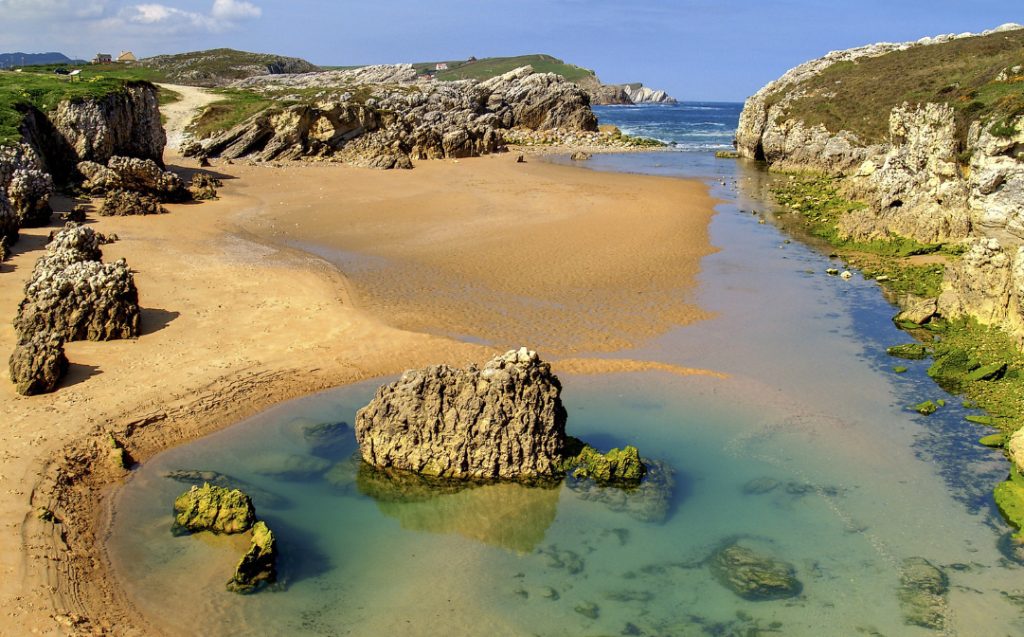
– Collection of satellite images of a specific point on our coast, La Virgen del Mar. In order to use the Sentinel 2 images obtained to make a comparison over time, we previously looked for the times when the low tide was occurring.
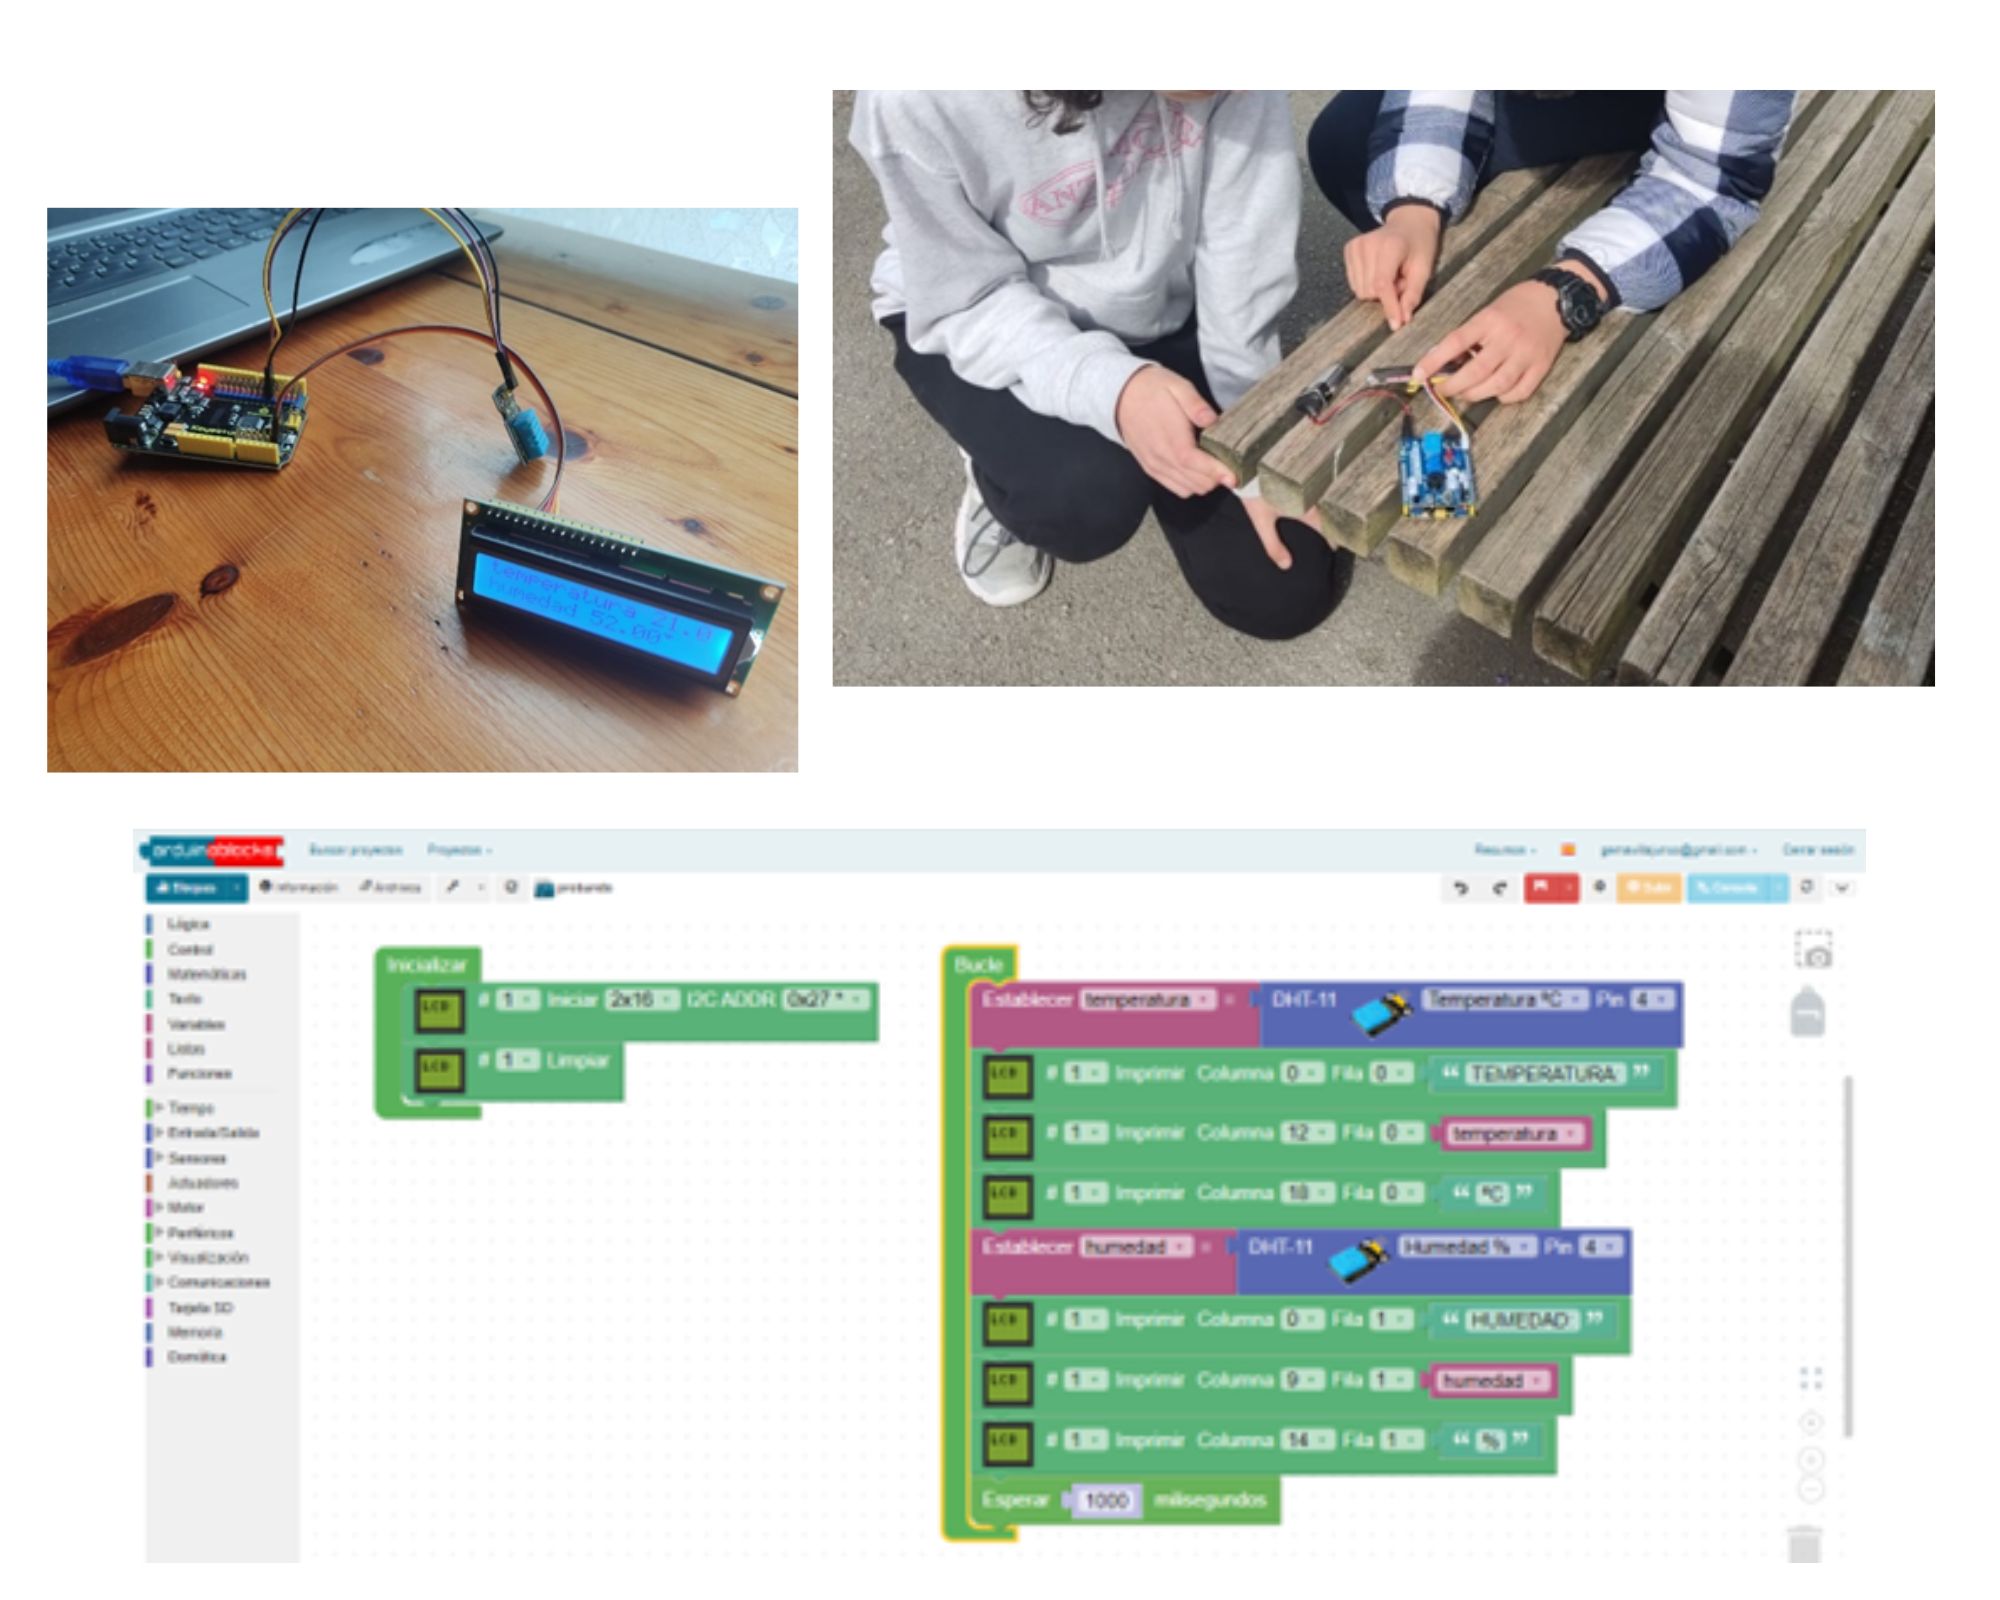
– Own data collection: temperature and humidity measurements have been taken every day for the last three months.
To obtain this data, an Arduino board has been used, to which a temperature and humidity sensor has been connected to capture the data and an LCD screen to display them. This assembly has been programmed using Arduinoblocks.
Once all the data had been obtained, different comparisons were made:
– Compare the data obtained by us with the data provided by the AEMET to see the deviation that may exist between them.
– Compare the data obtained in these three months of observation with previous years.
– Compare annual temperature averages since 1973
– Compare Sentinel 2 images in the chosen area at low tide times to see the sea level in each case.
Ante el cambio climático, nos hemos planteado averiguar cuáles han sido las variaciones de temperatura y humedad que se han producido en nuestro entorno más cercano. Sabiendo que, el cambio de estas variables afecta al nivel de nuestros mares y océanos, nos preocupa la posibilidad de que en un futuro no muy lejano desaparezcan las playas de nuestras costas.
Para conseguir los datos necesarios se han seguido tres líneas diferentes:
• Recogida de datos de temperatura y humedad en las últimas décadas consultando los archivos de la Agencia Estatal de Meteorología. Con los datos obtenidos se han realizado gráficas que muestran la evolución en el tiempo.
• Recogida de imágenes de satélite de un punto concreto de nuestra costa, La Virgen del Mar. Para que las imágenes del Sentinel 2 obtenidas nos sirviesen para hacer una comparativa en el tiempo, hemos buscado previamente los momentos en que se producía la bajamar.
• Recogida de datos propios: durante los tres últimos meses todos los días se han tomado medidas de temperatura y humedad
Para la obtención de estos datos se ha utilizado una placa Arduino, a la que se ha conectado un sensor de temperatura y humedad que capte los datos y una pantalla LCD que nos permita visualizarlos. Se ha procedido a la programación de dicho montaje utilizando Arduinoblocks.
Una vez obtenidos todos los datos se ha procedido a realizar diferentes comparativas:
• Comparar los datos obtenidos por nosotros con los que nos da la AEMET para ver la desviación que puede haber entre unos y otros.
• Comparar los datos obtenidos en estos tres meses de observación con años anteriores.
• Comparar las medias anuales de temperatura desde 1973
• Comparar imágenes del Sentinel 2 en la zona elegida en momentos de bajamar para ver el nivel del mar en cada caso
Once the data has been obtained and the different graphs have been made, the following conclusions can be drawn:
– The temperature measurements taken by the students show a small difference with respect to those provided by the State Meteorological Agency, our data being around 2ºC higher. As for humidity, the data are similar.
– The annual temperature averages studied from 1973 to the present have increased over the years, and will continue to increase if we take into account the trend line that has been extrapolated. We have also observed that peaks occur in certain years. We have also observed that heat waves occur in which there is an abrupt increase in a short period of time, and in the same way, in the winter period, cold waves appear in which the opposite phenomenon occurs.
– The annual humidity averages have not undergone a significant variation, so it can be thought that this has no repercussion on the study we are carrying out.
– In the analysis carried out in the months under study, i.e. in the spring season, we can see that the trend is similar to the result obtained with the annual averages.
– Comparing satellite images obtained in different years, we can see that the sea level is rising appreciably, as can be seen in the attached images.
We could conclude that rising temperatures cause sea levels to rise and that therefore some of our sandy beaches would be lost.
Una vez obtenidos los datos y realizado las diferentes gráficas podemos llegar a las siguientes conclusiones:
• Las medidas de temperatura y realizadas por los alumnos presentan una pequeña diferencia con respecto a las que ofrece la Agencia Estatal de Meteorología, nuestros datos están alrededor de 2ºC por encima. En cuanto a la humedad, los datos son similares.
• Las medias de temperatura anuales estudiadas desde 1973 hasta ahora han aumentado a lo largo de los años, y seguirá en aumento si tenemos en cuenta la línea de tendencia que se ha realizado por extrapolación. Hemos observado también que en determinados años se producen picos. También hemos observado que se producen olas de calor en las que hay un aumento brusco en un periodo corto de tiempo y de la misma forma en el periodo invernal aparecen olas de frío en las que ocurre el fenómeno contrario.
• Las medias de humedad anuales no han sufrido una variación significativa por lo que se puede pensar que en el estudio que estamos realizando no tiene ninguna repercusión.
• En el análisis realizado en los meses de estudio, es decir, en la época primaveral comprobamos que la tendencia es similar al resultado obtenido con las medias anuales.
• Comparando las imágenes de satélite obtenidas en diferentes años podemos observar que el nivel del mar está sufriendo un aumento apreciable como se puede observar en las imágenes adjuntas.
Podríamos llegar a la conclusión de que el aumento de la temperatura hace aumentar el nivel del mar y que por lo tanto algunos de nuestros arenales se perderían.

Considering that the temperature is rising and this causes changes in our environment, measures must be taken to control these changes. We have decided that we too can help with the following actions:
– Use the bicycle to get around.
– Saving water in our daily life: bathing instead of showering, turning off the tap if we are not using it at that moment.
– Turn off lights when they are not needed.
– Recycle paper, plastic, glass.
– Raise awareness of the problem among the people around us and encourage them to take the same actions as we do.
Teniendo en cuenta que la temperatura está aumentando y esto produce cambios en nuestro entorno se deben tomar medidas para controlar estos cambios. Hemos decidido que nosotros también podemos colaborar con las siguientes acciones:
• Utilizar la bicicleta para desplazarnos.
• Ahorrar agua en nuestra vida diaria: baño en lugar de ducha, cerrar el grifo si no lo estamos usando en ese instante
• Apagar las luces cuando no sean necesarias.
• Reciclar papel, plástico, vidrio.
• Concienciar a las personas de nuestro entorno del problema y animarlas a llevar las mismas acciones que nosotros.
This project was automatically translated into English.
Projects are created by the teams and they take the full responsibility of the shared data.
← All projects