Climate Detectives Projects 2022-2023
Project title: Are lichens suitable bio-indicators for air quality analysis?
Team: CC MERCEDES
Colegio Mercedes Santander Spain 10 Student’s age: 14-15 years old, 16-17 years old
Are lichens suitable bio-indicators for air quality analysis?
¿Son los líquenes bioindicadores adecuados para analizar la calidad del aire?

Lichens are symbiotic organisms between a fungus and an alga or cyanobacterium. They are of great ecological importance as bioindicators due to their sensitivity to changes in air composition and the presence of pollutants. This is because they are able to accumulate atmospheric pollutants such as heavy metals, nitrogen oxides and sulphur dioxide in their tissues, which allows them to reflect the concentration of these pollutants in the air. In addition, lichens are slow-growing and very resilient, which allows them to be used as long-term indicators.
Among the most common pollutants in cities are airborne particles smaller than or equal to 10 micrometres in diameter (PM10). They can be emitted by natural sources such as dust and sand from the ground, or by anthropogenic sources such as traffic, industrial emissions and the burning of fossil fuels.
PM10 is measured in micrograms per cubic metre (µg/m3), which is a unit of measurement used to express the concentration of particulate matter in the air. Elevated levels can have detrimental effects on human health, especially for people with respiratory and cardiovascular diseases, and can contribute to air pollution and climate change. Monitoring and control of PM10 levels is therefore important to protect public health and the environment.
PM10 levels in the air are generally classified into four categories according to their concentration:
– Good: Less than 50 µg/m3
– Moderate: Between 50 and 150 µg/m3
– Harmful to the health of sensitive groups: Between 150 and 250 µg/m3
– Harmful to general health: More than 250 µg/m3
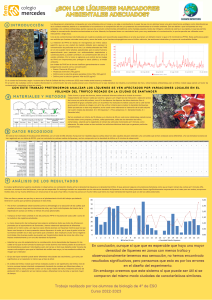
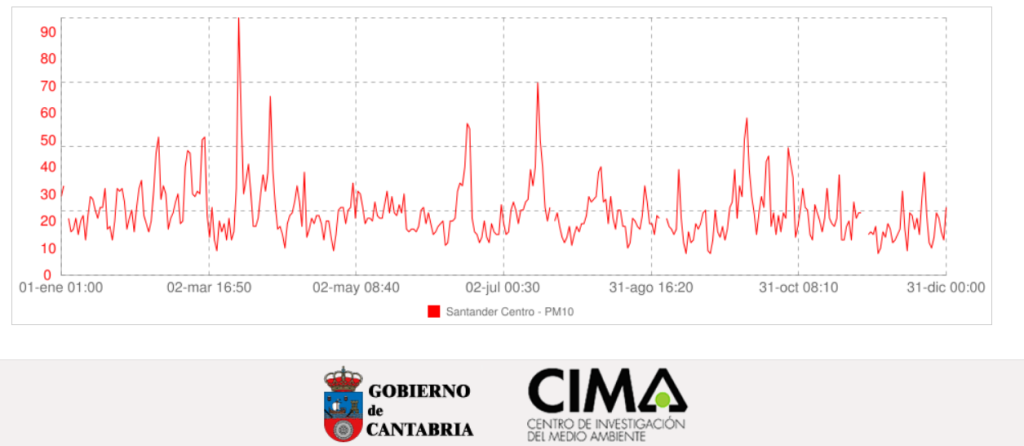
In the city of Santander, according to data from the Air Quality Network, we had good to moderate levels in 2022.
Los líquenes son organismos simbióticos entre un hongo y un alga o cianobacteria. Tienen una gran importancia ecológica como bioindicadores debido a su sensibilidad a los cambios en la composición del aire y la presencia de contaminantes. Esto es debido a que son capaces de acumular contaminantes atmosféricos como metales pesados, óxidos de nitrógeno y dióxido de azufre en sus tejidos, lo que les permite reflejar la concentración de estos contaminantes en el aire. Además, los líquenes tienen un crecimiento lento y son muy resistentes, lo que les permite ser utilizados como indicadores a largo plazo.
Entre los contaminantes más habituales en ciudades están las partículas suspendidas en el aire de diámetro menor o igual a 10 micrómetros (PM10). Pueden ser emitidas por fuentes naturales como polvo y arena del suelo, o por fuentes antropogénicas como el tráfico, las emisiones industriales y la quema de combustibles fósiles.
La medición de PM10 se realiza en microgramos por metro cúbico (µg/m3), que es una unidad de medida utilizada para expresar la concentración de partículas en el aire. Los niveles elevados pueden tener efectos perjudiciales para la salud humana, especialmente para personas con enfermedades respiratorias y cardiovasculares, y pueden contribuir a la contaminación del aire y el cambio climático. Por lo tanto, la vigilancia y el control de los niveles de PM10 son importantes para proteger la salud pública y el medio ambiente.
Los niveles de PM10 en el aire se clasifican generalmente en cuatro categorías de acuerdo con su concentración:
• Bueno: Menos de 50 µg/m3
• Moderado: Entre 50 y 150 µg/m3
• Dañino para la salud de grupos sensibles: Entre 150 y 250 µg/m3
• Dañino para la salud en general: Más de 250 µg/m3
En la ciudad de Santander, según los datos de la Red de Calidad del Aire, tuvimos en 2022 unos niveles entre buenos y moderados.

We have analysed several streets independently (at least 3 streets per pupil or group) and without any prior indication or selection of the area, in order to have random data available. Initially we have carried out the analysis in the street where the school is located in order to unify criteria, given that this is a very subjective data, four levels of density have been used as a reference (0 = No lichens; 1 = Little presence; 2 = Medium density; 3 = High density).
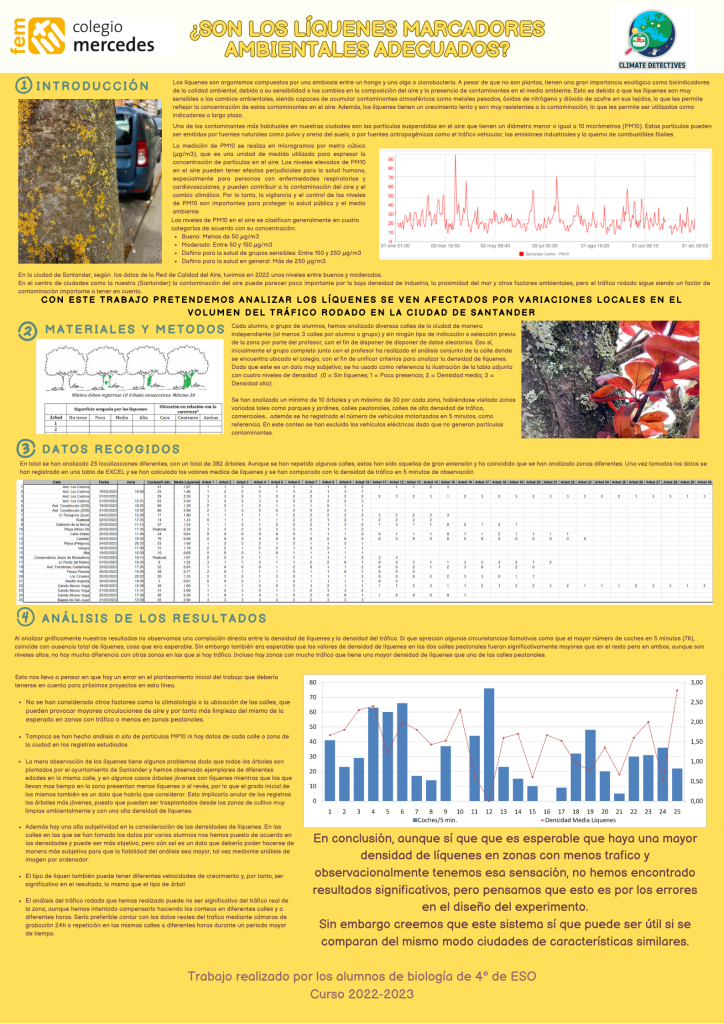
A minimum of 10 trees and a maximum of 30 trees were analysed for each area, having visited a variety of areas such as parks and gardens, pedestrian streets, streets with high traffic density, shopping streets, etc. In addition, the number of motorised vehicles in 5 minutes was recorded as a reference. In this count, electric vehicles have been excluded as they do not generate polluting particles. A total of 25 different locations were analysed, with a total of 382 trees. The data were recorded in an EXCEL table and the average lichen values were calculated and compared with the traffic density in 5 minutes of observation.
When analysing our results graphically, we did not observe a direct correlation between lichen density and traffic density. There are some striking circumstances, such as the fact that the highest number of cars in 5 minutes (76) coincides with the total absence of lichens, which was to be expected. However, it was also to be expected that the lichen density values in the two pedestrian streets would be significantly higher than in the rest, but in both, although they are high levels, there is not much difference with other areas where there is traffic. There are even areas with a lot of traffic that have a higher lichen density than one of the pedestrian streets.
Hemos analizado diversas calles de manera independiente (al menos 3 calles por alumno o grupo) y sin ningún tipo de indicación o selección previa de la zona, con el fin de disponer de disponer de datos aleatorios. Inicialmente hemos realizado el análisis en la calle donde se encuentra ubicado el colegio con el fin de unificar criterios, dado que este es un dato muy subjetivo, se han usado como referencia cuatro niveles de densidad (0 = Sin líquenes; 1 = Poca presencia; 2 = Densidad media; 3 = Densidad alta).
Se han analizado un mínimo de 10 árboles y un máximo de 30 por cada zona, habiéndose visitado zonas variadas tales como parques y jardines, calles peatonales, calles de alta densidad de tráfico, comerciales… además se ha registrado el número de vehículos motorizados en 5 minutos, como referencia. En este conteo se han excluido los vehículos eléctricos dado que no generan partículas contaminantes. En total se han analizado 25 localizaciones diferentes, con un total de 382 árboles. Los datos se han registrado en una tabla de EXCEL y se han calculado los valores medios de líquenes y se han comparado con la densidad de tráfico en 5 minutos de observación.
Al analizar gráficamente nuestros resultados no observamos una correlación directa entre la densidad de líquenes y la densidad del tráfico. Si que aprecian algunas circunstancias llamativas como que el mayor número de coches en 5 minutos (76), coincide con ausencia total de líquenes, cosa que era esperable. Sin embargo también era esperable que los valores de densidad de líquenes en las dos calles peatonales fueran significativamente mayores que en el resto pero en ambos, aunque son niveles altos, no hay mucha diferencia con otras zonas en las que si hay tráfico. Incluso hay zonas con mucho tráfico que tiene una mayor densidad de líquenes que una de las calles peatonales

Our results lead us to think that there is an error in the approach of the work that should be taken into account for future projects in this line.
– The climate or location of streets can lead to more air circulation and therefore to cleaner air.
– On-site analysis of PM10 particulate matter or data for each street/area of the city in the studied records.
– We have observed trees of different ages in the same street, and in some cases young trees with lichens while those that have been in the area for a longer time have less lichens or the other way round, so the initial degree of lichens is also a factor to be considered.
– There is a high degree of subjectivity in the consideration of lichen densities. It should be possible to do this in a more subjective way to make the analysis more reliable, by computer image analysis.
– The type of lichen can also have different growth rates and therefore be significant in the outcome, as can the type of tree.
– The road traffic analysis we have carried out may not be meaningful for the actual traffic in the area, although we have tried to compensate for this by counting on different streets at different times. It would be preferable to have the actual traffic data ,24-hour camera recording or repetition on the same streets at different times over a longer period of time.
In conclusion, it is to be expected that there is a higher density of lichens in areas with less traffic and observationally we have this feeling, we have not found significant results, but we think that this is due to errors in the design of the experiment.
However, we believe that this system can be useful if cities with similar characteristics are compared in the same way.
Nuestros resultados nos llevan a pensar en que hay un error en el planteamiento del trabajo que debería tenerse en cuenta para próximos proyectos en esta línea.
• La climatología o la ubicación de las calles pueden provocar mayores circulaciones de aire y por tanto más limpieza del aire
• Análisis in situ de partículas MP10 o datos de cada calle o zona de la ciudad en los registros estudiados.
• Hemos observado árboles de diferentes edades en la misma calle, y en algunos casos árboles jóvenes con líquenes mientras que los que llevan mas tiempo en la zona presentan menos líquenes o al revés, por lo que el grado inicial de los mismos también es un dato que habría que considerar.
• Hay una alta subjetividad en la consideración de las densidades de líquenes. Debería poder hacerse de manera más subjetiva para que la fiabilidad del análisis sea mayor, tal vez mediante análisis de imagen por ordenador.
• El tipo de liquen también puede tener diferentes velocidades de crecimiento y, por tanto, ser significativo en el resultado, lo mismo que el tipo de árbol.
• El análisis del tráfico rodado que hemos realizado puede no ser significativo del tráfico real de la zona, aunque hemos intentado compensarlo haciendo los conteos en diferentes calles y a diferentes horas. Sería preferible contar con los datos reales del trafico mediante cámaras de grabación 24h o repetición en las mismas calles a diferentes horas durante un periodo mayor de tiempo.
En conclusión, aunque sí que es esperable que haya una mayor densidad de líquenes en zonas con menos trafico y observacionalmente tenemos esa sensación, no hemos encontrado resultados significativos, pero pensamos que esto es por los errores en el diseño del experimento.
Sin embargo creemos que este sistema sí que puede ser útil si se comparan del mismo modo ciudades de características similares.
This project was automatically translated into English.
Projects are created by the teams and they take the full responsibility of the shared data.
← All projects


