Climate Detectives Projects 2022-2023
Project title: Rainfall in Bruges
Team: De klimaatonderzoekers
Buso Spermalie De Kade Brugge Belgium 7 Student’s age: 14-15 years old
Q1: How many millimetres of rain fell on the playground of the secondary school during the months of December, January, February and March. Q2: How many litres of water would infiltrate in the soil if we would change the playground into a greener area.
Rainfall
We are measuring the amount of rain by using a rain gauge and by checking it every day.
We keep the data in a shared spreadsheet. Every student takes its turn in recording the data.
Due to weekends and holidays, we haven’t been able to collect all the data. Thanks to the climate scientists at KMI, we were able to obtain the missing information.
Infiltration
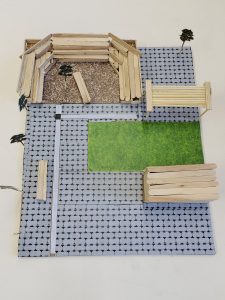
How can we modify our playground so that rain seeps into the ground? This was the main question when starting the project. The students started with a brainstorm. Then the playground was measured, and a map was made.
The students looked for the types of soil suitable for water to seep into the ground: grass, cobblestones, soil, artificial grass, bark, permeable stones, concrete, asphalt.
During the project, the need for more greenery on the playground also came up. The presence of more trees, plants, flowers and bee hotels would be nice additions.
Main results and conclusion
December data
December 2011 is the wettest December in the chart: 142.4 mm of rain fell during that month.
In December 2022 there was 46 mm of rain.
The least rain fell in December 2016: 8.1 mm of rain.
January data
January 2015 is the wettest January in the chart: 96.7 mm of rain fell during that month.
January 2022 was the driest January with 17.6 mm of rain.
In January 2023, 39 mm of rain fell during that month.
February data
February 2023 is the least wet month since 2007 with ‘only’ 4.6 mm of rain.
The wettest February is 2020 with 79.7 mm of rain.
March data
March 2022 is the ‘driest’ March with 12.8 mm of rain.
The wettest March is the one of 2008 with 94.7 mm of rain.
Conclusion rainfall
There hasn’t been exceptionally more rain in the months of December 2022, January 2023, February 2023 and March 2023. February 2023 was standing out with the least amount of rain in 15 years.
Conclusion softening the soil:
Roughly estimated, we want to soften about 270 m²: of our playground.
In December (46mm),in January (39mm), February (4.6mm) and March (59.5 mm) together 149.1 mm of rain fell.
Calculation: rainfall per m²:
149.1 mm =149.1 litres per m²:
149.1 m2 * 270 m²: softened
-> 40,257 litres of extra water in the soil

Building a model of our proposal.
Address the principal and present the project and proposal to change the playground of the school.
Projects are created by the teams and they take the full responsibility of the shared data.
← All projects


